Volume Profile & Anchored VWAP MT4 Indicator
 By RaptozGroup
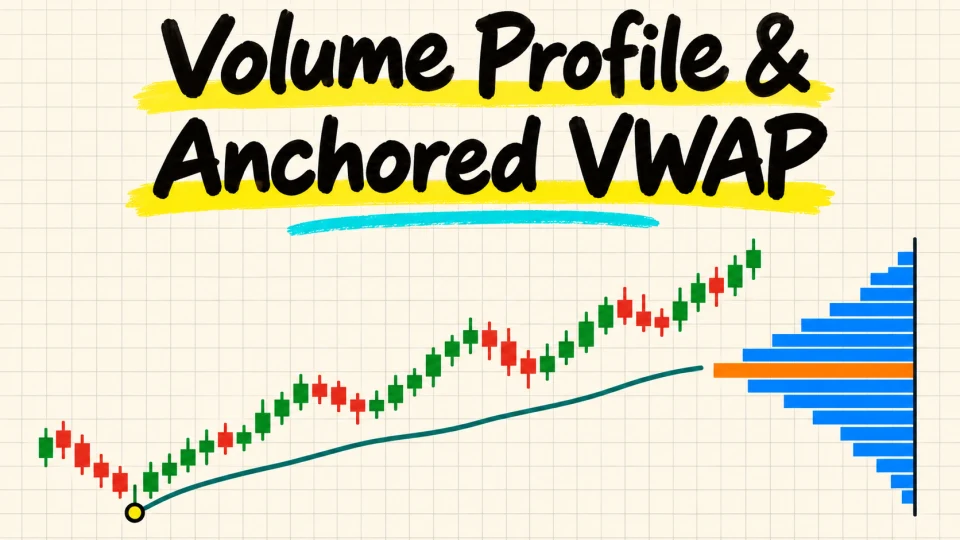
Choose a starting candle and compare two views of the same period: its volume-weighted average price and the estimated distribution of volume across price levels.
What is the Volume Profile & Anchored VWAP indicator?
Drag the anchor line to a chart event, enter a fixed start time, or use a rolling, daily, weekly or monthly window. Moving the anchor changes the candles used by both calculations.
How the calculation works
VWAP weights each candle’s typical price, the average of high, low and close, by its volume. The profile distributes candle volume across price rows in proportion to their overlap with the candle range. The row with the most estimated volume is the point of control (POC). Starting there, the value area expands toward the larger adjacent row until it reaches the configured share of volume.
What this guide covers
Volume Profile & Anchored VWAP settings on MT4
These are the actual inputs and defaults in RaptozGroup version 4.00. Other implementations may differ. Defaults are starting points, not optimized trading recommendations.
The default anchor is a draggable chart line, initially based on a 300-bar lookback when no start time is supplied. The profile uses 50 price rows and a 70% value area.
| Parameter | Default | What it changes |
|---|---|---|
| AnchorMode | AV_DRAG | Anchor |
| AnchorTime | 0 | Fixed time (also first position of the drag line) |
| LookbackBars | 300 | Bars for rolling mode / default drag position |
| ShowVWAP | true | Show VWAP |
| ShowBands | true | Show deviation bands |
| Band1 | 1.0 | Inner band (x standard deviation) |
| Band2 | 2.0 | Outer band (x standard deviation) |
| PreferRealVolume | true | Use real volume when the broker provides it |
| ShowProfile | true | Show volume profile |
| PriceBins | 50 | Price rows |
| ValueAreaPercent | 70 | Value area (% of volume) |
| ProfileSide | PROF_RIGHT | Profile position |
| ProfileWidthBars | 40 | Max width of the longest row (bars, shrinks to fit) |
| ProfileGapBars | 3 | Gap after the last candle (bars) |
| Theme | AVT_AUTO | Theme |
| ProfileOpacity | 45 | Profile opacity % (5 to 100) |
| ShowLabels | true | Labels (POC, VAH, VAL, VWAP) |
| LabelFontSize | 8 | Label font size |
| AutoChartShift | true | Turn on chart shift (room for the profile) |
Signal examples & trade planning
Choose the anchor
Place the draggable line at the event you want to study, or choose a calendar period for a repeatable start.
Compare VWAP and the POC
VWAP averages weighted prices across the window. The POC identifies the single busiest estimated price row.
Read the value area
VAH and VAL mark the outer edges of the selected rows. The default target is 70% of the window’s volume.
Worked interpretation
A window can have its POC near the low while VWAP sits higher: one lower row may contain the most volume, while many smaller rows above it pull the weighted average upward.
These examples explain indicator readings. They are not live signals or evidence of a profitable strategy. Include spread, commission, slippage, and losing setups in any evaluation.
Signal timing, repainting & limitations
The profile estimates volume at price from candle ranges. It cannot reconstruct which prices traded within each candle. With PreferRealVolume enabled, all candles in the window need positive broker-reported volume; otherwise the calculation uses tick volume for the window.
To inspect a version, record its signals at candle close, then refresh the chart and compare those same timestamps. Repeat with enough history loaded. If a higher timeframe is used, check whether that candle is still open. Passing a few examples is not a guarantee that all historical signals are stable.
VWAP bands and value area
VWAP bands measure volume-weighted dispersion around the average. The value area is built from adjacent profile rows around the POC. Their bounds can differ.
Free Volume Profile & Anchored VWAP download for MT4
Volume Profile & Anchored VWAP · MT4
RaptozGroup · Version 4.00 · Free source and compiled files
Choose the compiled file to install directly, or download the editable source for MetaEditor. No DLLs, external indicators, or automated order execution.
Compiled with MetaEditor. The indicator draws an anchored VWAP, deviation bands and a candle-based volume profile.
How to install a compatible version on MT4
Download the MT4 file above. The compiled .ex4 file is ready to install; the .mq4 source can be opened and compiled in MetaEditor.
- Open the MT4 desktop terminal and select File → Open Data Folder.
- Copy the
.mq4source or.ex4compiled file into MQL4 → Indicators. - For MQL4 source, open it in the MT4 MetaEditor and compile it. Resolve compiler errors before attempting to attach it.
- Refresh the Navigator or restart the terminal, then attach the indicator to a demo chart.
- Check the Inputs, Colors, and Visualization tabs. Compare the plotted output and signal timing with the implementation's documentation.
- Start on a standard MT4 timeframe such as M15 or H1. Custom or offline charts may need additional support from the indicator.
If the indicator does not appear
Confirm the platform and folder, load more chart history, and inspect the Experts and Journal logs. Check whether a separate indicator window opened below the chart. Missing dependencies or compiler errors need fixing in the actual file; changing its extension will not resolve them.
Implementation references
Review the implementation before installing
The linked material is a third-party reference, not a Trader Sentiments-tested download. Check its platform and licence. A TradingView example illustrates the concept but requires a separate MQL implementation for MetaTrader.
MetaTrader documentation on candle prices and volumesVolume Profile & Anchored VWAP MT4: frequently asked questions
What do the two band settings control?
Band1 and Band2 set the inner and outer distances from VWAP in volume-weighted standard deviations. They default to one and two.
Why does the POC move when I change PriceBins?
Changing the row count changes the price interval assigned to each row. With different boundaries, a different row can accumulate the largest share of estimated volume.
Does Volume Profile & Anchored VWAP repaint?
The open candle can change the readings. Moving the anchor or advancing a rolling window changes the underlying sample and recalculates the profile and VWAP.
Can I use an MT5 file in MT4?
No. Use a native .mq4 source file or .ex4 compiled file for MT4. Renaming the file extension does not convert the code.
Can I install it in the MT4 mobile app?
Custom MQL indicators require the desktop terminal. The mobile app does not load custom .mq4 or .ex4 files. A desktop implementation may send push notifications if it supports them.
What is included in the download?
Free RaptozGroup source and compiled indicator files, version 4.00. Compiled with MetaEditor. The indicator draws an anchored VWAP, deviation bands and a candle-based volume profile. Broker-specific chart behavior and strategy profitability have not been validated. Test the indicator on a demo chart before relying on it.