
 Audited by RaptozGroup Quantitative Research Desk•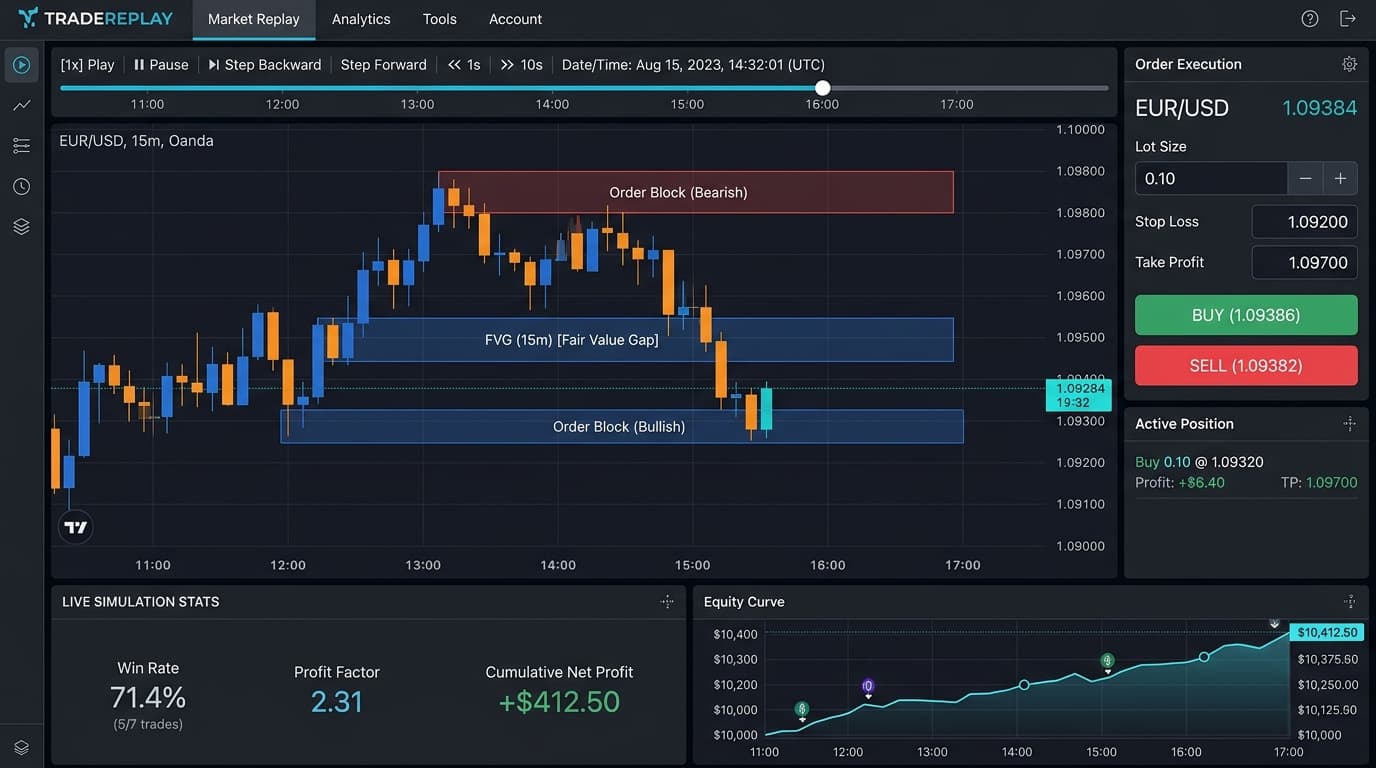
Multi-timeframe market simulation running bar replay with realistic tick data, order execution, and equity curve tracking.
Before risking real capital or entering a prop firm evaluation, professional traders rigorously backtest their strategies. Market simulators reconstruct historical price feeds, enabling you to stress-test your statistical edge, measure peak floating drawdown, and calibrate win rates across varied market volatility regimes. In this comprehensive Best Backtesting Software (2026) audit, our quantitative team evaluated the 7 leading market simulators across data fidelity, tick execution realism, pricing models, and speed.
Executive Verdict
The Bottom Line
Backtesting software is not merely a tool for viewing historical charts—it is an empirical risk engine that proves whether your strategy possesses a quantifiable statistical edge. For manual SMC and price action traders, FX Replay provides the most realistic bar-replay environment with prop firm rule tracking. For algorithmic developers, MetaTrader 5 offers unmatched 64-bit multi-threaded speed with zero software fees.
Interactive Backtesting Software Finder
Filter by trading style, target market, budget, and operating system.
Top 7 Backtesting Platforms (2026 Detailed Reviews)
Every backtesting tool listed below has been verified by the TraderSentiments research desk. Click on any preview image to expand a full-resolution interactive lightbox.
Verified Software Showcase
Evaluated across tick data modeling fidelity, execution realism, historical news overlays, and algorithmic speed.
FX Replay

FX Replay delivers TradingView-grade charting into an authentic market simulation engine. Traders can place market, limit, and stop orders bar-by-bar with customizable risk parameters ($ or % of equity), simulate prop firm evaluation rules (FTMO, FundedNext) with hard loss alarms, and automatically sync trade logs into an integrated performance dashboard.
MetaTrader 5 (MT5)

The MetaTrader 5 Strategy Tester features a 64-bit multi-threaded simulation engine capable of running distributed genetic algorithm optimizations across local CPU clusters and the MQL5 Cloud Network. When paired with real tick data, it achieves 99.9% modeling quality with floating spreads, real liquidity provider tick quotes, and slippage simulation.
TradingView
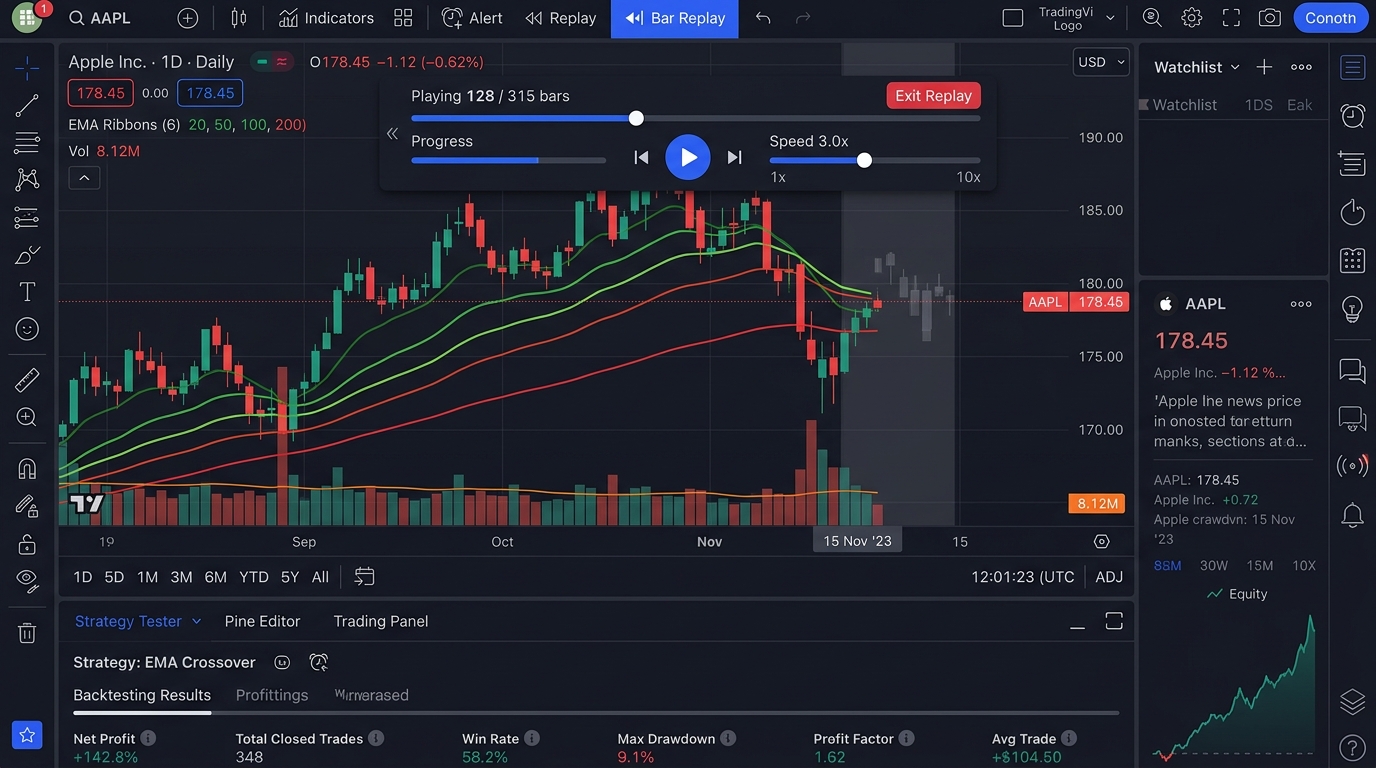
TradingView offers the premier charting ecosystem worldwide. Its 'Bar Replay' tool lets traders cut off historical price action and step through candles manually. Simultaneously, its built-in 'Strategy Tester' allows Pine Script programmers to backtest rule-based algorithms with comprehensive reports on net profit, win rate, maximum drawdown, and profit factor.
Forex Tester 6

Forex Tester 6 is a specialized desktop 'flight simulator' built solely for backtesting. It synchronizes multiple timeframes simultaneously, overlays historical economic news events (NFP, FOMC, CPI) directly onto the price chart, and features 'Mystery Mode' (blind backtesting) which completely anonymizes asset names and dates to eradicate trader hindsight bias.
TrendSpider

TrendSpider is the leading automation-first trading platform. Its visual Strategy Tester allows traders to build intricate entry and exit rules using natural point-and-click conditions (e.g. 'Price closes above 50 EMA on 1H chart while Daily RSI > 55') without writing a single line of code. It backtests across decades of market regimes in seconds.
QuantConnect (LEAN)

QuantConnect operates on the open-source LEAN algorithmic trading engine. It gives quantitative researchers access to institutional-grade tick data, corporate fundamentals, options chains, and alternative data. Quants can research, backtest, and deploy cross-asset statistical arbitrage strategies directly to institutional brokers.
Soft4X Forex Simulator
Soft4X is an Expert Advisor script that runs directly inside MetaTrader 4, transforming MT4's standard charts into an interactive bar replay terminal. It allows traders to practice manual trading using all custom MT4 indicators, templates, and expert advisors without paying ongoing subscription fees.
Master Comparison Matrix: 12 Core Factors
Direct side-by-side technical evaluation across pricing, tick data quality, multi-timeframe synchronization, algorithmic compatibility, and platform operating systems:
| Software | Pricing | Trading Style | Tick Data | Multi-Timeframe | Algo / EAs | Action |
|---|---|---|---|---|---|---|
FX Replay Manual Market Replay | From ~$35/month | Discretionary price action traders | 1-Minute OHLC & Real Replay Ticks | ✓ Synchronized | None (100% Visual) | Visit |
MetaTrader 5 (MT5) Automated & Algorithmic | Free | Algorithmic traders | 99.9% Real Ticks (via Tick Data Suite / Broker Feed) | ✓ Synchronized | MQL5 (or Visual EA Builders) | Visit |
TradingView Charting & Visual Replay | Free basic / Paid $14.95–$59.95/mo | Swing traders | 1-Second to Daily OHLC Bars | ✓ Synchronized | Optional (Pine Script for Algo) | Visit |
Forex Tester 6 Dedicated Market Simulator | $99–$299 one-time | Dedicated full-time traders who want intense | 16+ Years Tick Data (1-minute & real ticks) | ✓ Synchronized | None (Optional C++ / Delphi) | Visit |
TrendSpider No-Code AI & Multi-Factor | ~$40–$80/month | Technical swing traders | 50+ Years US Equities, Forex & Crypto | ✓ Synchronized | 100% No-Code (Visual Conditions) | Visit |
QuantConnect (LEAN) Python & Institutional Quant | Free Open-Source / Cloud from $20/mo | Quantitative researchers | Institutional Tick & Minute Order Book | ✓ Synchronized | Python or C# Required | Visit |
Soft4X Forex Simulator MT4 Manual Simulator | ~$109 one-time | Traders who already rely heavily on MT4 custom indicators and want an affordable | Broker History & 1-Minute Bars | ✓ Synchronized | None (MT4 Expert Advisor) | Visit |
The 5-Step Institutional Backtesting Protocol
Professional quantitative desks configure backtests with rigorous execution friction parameters to ensure historical win rates translate reliably to live funded capital:
Establish 99.9% Real Tick Data
Never backtest intraday strategies on interpolated 1-minute OHLC bars. Use real tick data to resolve exact intra-bar stop loss vs take profit trigger sequences.
Model Variable Spreads & Slippage
Configure dynamic spreads (widening during news & rollover), apply 0.3–1.0 pip execution slippage, and deduct full round-turn broker commissions.
In-Sample vs Out-of-Sample Splitting
Calibrate strategy rules on 70% In-Sample data. Validate performance blindly on the remaining 30% Out-of-Sample data to confirm the edge is not curve-fitted.
Monte Carlo Stress-Testing
Shuffle historical trade order sequences over 1,000 iterations to measure maximum probable drawdown under clustered losing streaks.
Forward Live Incubation (Demo / Micro)
Before funding large accounts, execute the strategy for 4 to 8 weeks on a live demo or cent account to verify broker execution latency, swap rates, and psychological ease.
The 5 Deadly Backtesting Pitfalls
Sound Backtesting Habits
- ✓Uses 99.9% real tick data with floating spread modeling.
- ✓Maintains a trade sample size exceeding 200+ documented setups.
- ✓Reserves 30% untouched data for blind out-of-sample validation.
- ✓Deducts realistic broker round-turn commissions and financing swaps.
Costly Backtesting Fallacies
- ✕Overfitting indicators to match past market noise perfectly.
- ✕Assuming instantaneous order fills with zero slippage or requotes.
- ✕Testing only 15 trades over 2 weeks and assuming statistical validity.
- ✕Ignoring survivorship bias when backtesting stock or crypto universes.
Common Backtest Errors & Institutional Remedy Matrix
| Error / Bias | Risk Mechanism | Institutional Remedy Action |
|---|---|---|
| Overfitting (Curve-Fitting) | Too many indicator parameters memorize historical noise. | Limit strategy to ≤ 3 parameters and test on 30% blind out-of-sample data. |
| Zero-Slippage Fallacy | Assuming orders fill at exact requested prices during news. | Enforce 0.5 to 1.5 pip slippage penalty on all market breakout fills. |
| Survivorship Bias | Backtesting only surviving stocks, omitting delisted companies. | Use survivorship-bias-free data feeds (e.g. QuantConnect, Norgate Data). |
| Small Sample Size | Testing < 50 trades creates high random variance error. | Enforce a strict minimum sample size of 200+ closed trades across 3+ years. |
VPS, Tick Data & Hardware Requirements
Backtesting multi-year tick data and running genetic optimizations demands serious compute resources:
Recommended PC Hardware
- • CPU: 8-Core / 16-Thread processor (Intel i7/i9 or AMD Ryzen 7/9) for MT5 genetic optimization.
- • RAM: 16 GB minimum (32 GB recommended for multi-year tick databases).
- • Storage: Fast NVMe SSD (tick history archives require 20 GB–50 GB per currency pair).
Tick Data Quality Standards
- • Dukascopy / TrueFX: Reputable historical ECN tick archives.
- • Tick Data Suite (TDS): Connects directly into MT4/MT5 for floating spread simulation.
- • Broker Archives: Beware of standard broker 1-minute data which suffers from missing weekend bars.
Ready to Backtest Your Trading Strategy?
Top Manual: FX ReplayTop 100% Free: MetaTrader 5Top Quant: QuantConnect
Frequently Asked Questions: Best Backtesting Software
Quantitative algorithmic trading research desk specializing in MetaTrader MQL4/MQL5 automated systems, institutional order book mechanics, and risk management tools.
High-Risk Investment Notice: Trading foreign exchange (Forex), stocks, commodities, and CFDs on margin involves substantial risk and is not suitable for all investors. High leverage can work against you as well as for you, and losses can exceed initial deposits. Never risk capital you cannot afford to lose.
Simulation vs Live Market Realities: Backtested results are inherently hypothetical and calculated using past data. Past performance is never a guarantee of future returns. Market conditions, spread expansion, unexpected slippage during volatile news events, and execution latency can cause live outcomes to deviate significantly from simulated results.
Independent Editorial Review: TraderSentiments provides independent software evaluations, educational walkthroughs, and benchmark analysis for research purposes. This content does not constitute financial, investment, tax, or trading advice.