In the decentralized world of foreign exchange, understanding where market participants are positioned is one of the most critical elements of professional trading. A stop loss cluster represents a specific price level or narrow zone where a significant accumulation of stop loss orders has been placed by retail traders. Because retail market participants typically learn from the same textbooks, standard technical indicators, and retail trading courses, their behavior exhibits highly predictable patterns. Retail traders commonly place their stop loss orders at highly visible structural points on the chart: just past major swing highs, immediately below swing lows, near key support and resistance boundaries, and at prominent round numbers (such as 1.1000 or 1.2500).
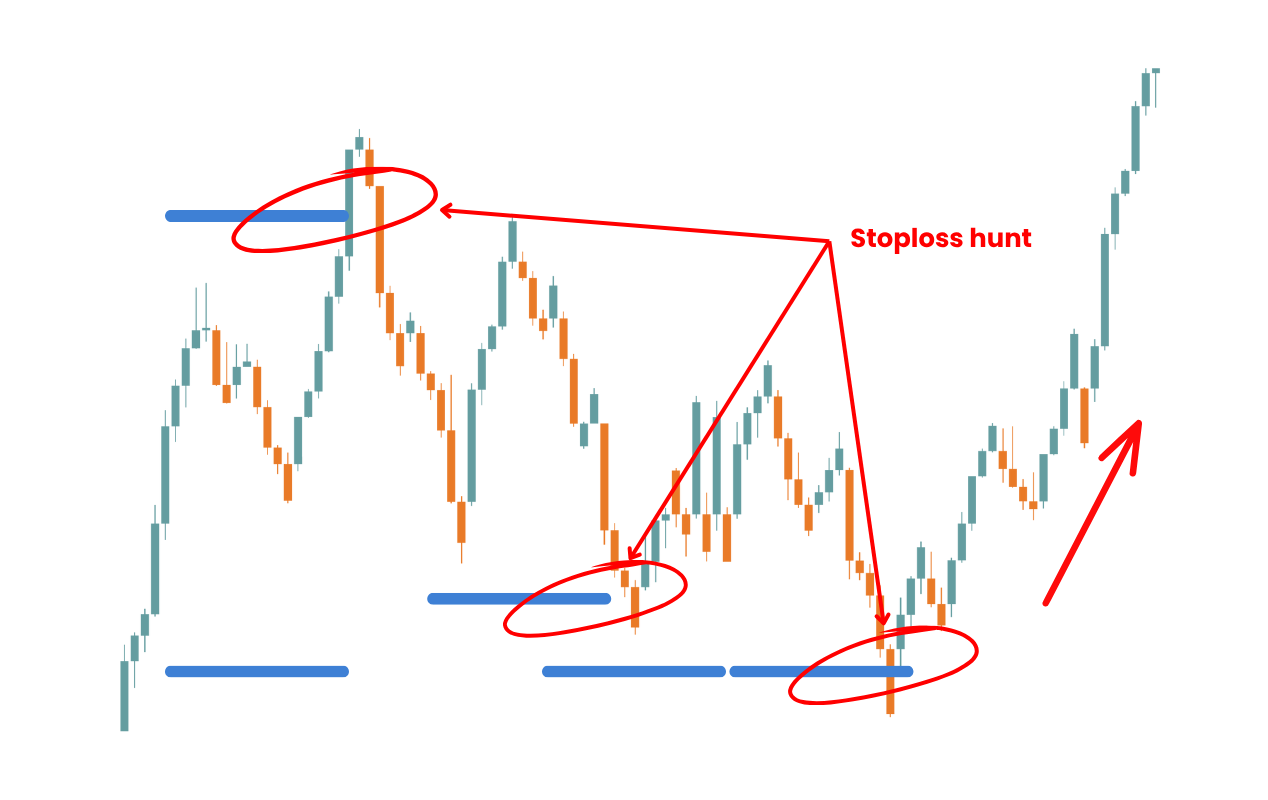
These clustered stop orders do not represent passive interests; they are pending market-executable orders waiting to be triggered. A buy stop loss order (placed by a trader holding a short position) instantly becomes a market buy order when the price touches it. Conversely, a sell stop loss order (placed by a trader holding a long position) turns into a market sell order when touched. When hundreds or thousands of retail accounts align their stops at the exact same level, they create a dense, localized pocket of pending order volume, which professional traders refer to as a **liquidity pool**.
On the Stop Loss Cluster Indicator map, these concentrations are processed and drawn as horizontal bands directly on the candlestick chart. The thickness, opacity, and intensity of these bands reflect the volume and density of the orders. A dark, thick band shows a highly concentrated stop zone containing a substantial amount of matching contract volume, while thin, semi-transparent bands denote minor stop accumulations. By mapping these bands, traders can peer directly into the aggregate order books of major brokers, revealing the exact price levels where the retail crowd has collectively drawn their lines in the sand.
To understand why stop loss clusters are so critical, one must grasp how large institutional participants—such as commercial banks, hedge funds, multinational corporations, and institutional market makers—operate in the financial markets. Unlike retail traders who transact in micro-lots or small standard lots, institutional players trade in hundreds of millions of units. Because of this massive scale, institutions cannot simply click a button and enter the market at the current spot price without causing massive, adverse price movements. If a major bank attempts to execute a buy order of 500 million EURUSD, the lack of available sell orders at the current price would push the price rapidly upward, resulting in terrible execution average pricing, a phenomenon known as **slippage**.
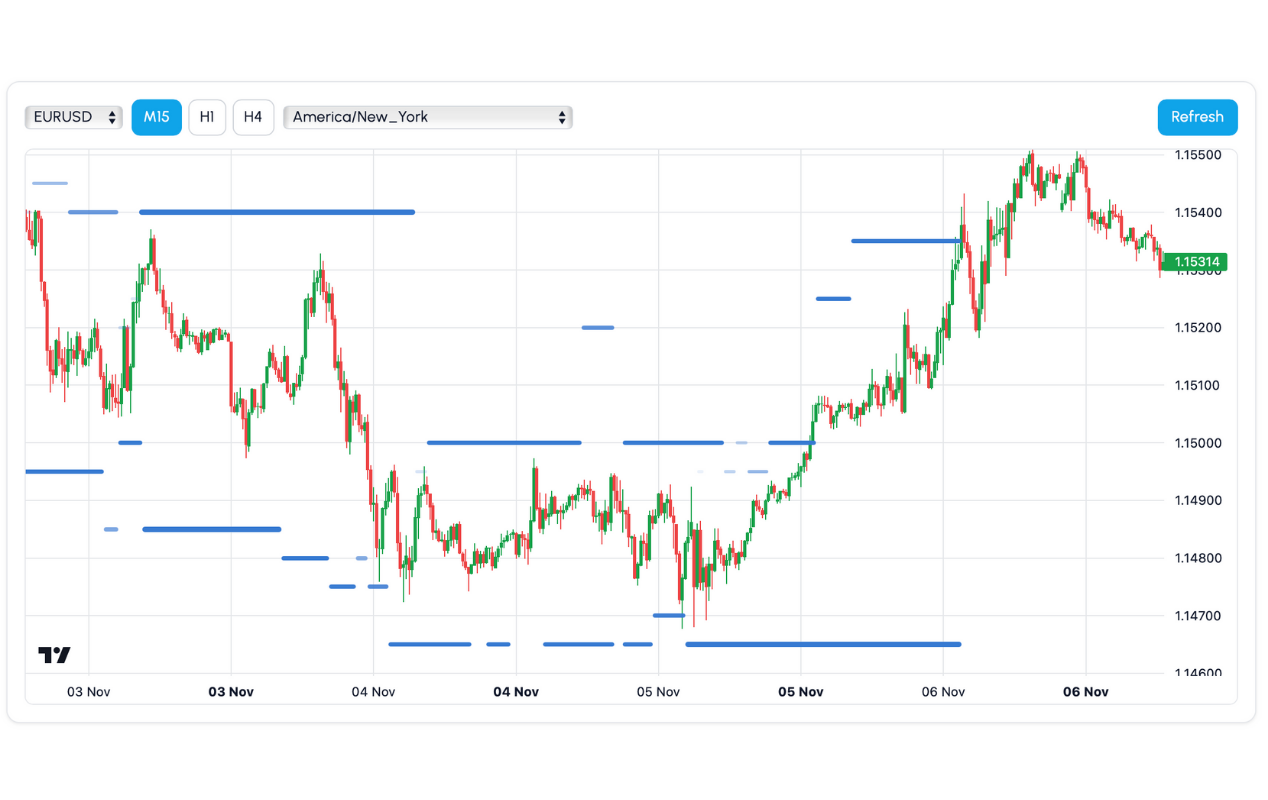
To minimize slippage, institutional traders require a concentrated counterparty volume. They need to find a price level where a massive quantity of opposite orders is ready to be filled. This is where retail stop loss clusters become invaluable targets. When a retail trader is long and places a sell stop loss, that stop loss acts as a guaranteed market sell order when triggered. If an institution wants to buy a massive position, they need a large volume of sell orders. By driving the market price into a retail sell stop loss cluster, the institution triggers thousands of retail sell stops, generating an instantaneous wave of market sell orders. The institution's institutional buy orders are matched directly against the retail sell stops, allowing the institution to enter their massive buy position with minimum slippage and maximum efficiency.
This deliberate matching of institutional orders against retail stops is commonly called a **liquidity hunt**, **stop raid**, or **liquidity sweep**. Because institutions understand exactly where retail traders place their stops (based on predictable chart structures), they use their capital power to temporarily push prices through those levels. Once the retail stops are triggered and the institutional orders are filled, the sudden source of liquidity disappears, and price rapidly rejects, leaving behind a long candlestick wick. This process clears the path for the market to reverse and run in the opposite direction.
Trading stop loss clusters requires a major shift in mindset. Instead of thinking like a retail trader and placing your stop loss inside the cluster, you must think like an institution and treat the cluster as your entry signal. Rather than placing a breakout trade in the direction of the momentum, you wait for the crowd\'s stops to get triggered before taking a contrarian stance.
Step 1: Identify High-Density Stop Clusters
Begin by looking at the H4 or H1 timeframe chart on the Stop Loss Cluster Indicator. Look for thick, prominent horizontal bands that sit just beyond swing highs or swing lows. These are your primary liquidity pools.
Step 2: Monitor Price Action on the M15 Timeframe
As price approaches the target band, switch to a lower timeframe like M15 or M5. Do not front-run the level. Allow the price to spike aggressively into the cluster. This is the moment where the retail stop orders are being executed.
Step 3: Confirm the Stop Hunt Completion (Rejection)
Wait for the current candle to close. To validate a successful liquidity sweep, the candle must leave behind a long wick and close back inside the trading range, outside the cluster zone. This shows that the stops were triggered, but the price could not sustain momentum, confirming institutional orders absorbed the liquidity.
Step 4: Look for a Shift in Market Structure (MSS)
For a high-probability entry, wait for a minor shift in market structure on the lower timeframe. In a bullish reversal scenario, look for the price to break above the last short-term swing high on the M15 chart. Once that structural shift occurs, you can place a limit order at the mitigation block or fair value gap.
By strictly adhering to these confirmation steps, you avoid the trap of catching a falling knife. Many retail traders lose money because they attempt to short a strong upward move without waiting for structural confirmation. Waiting for a sweep, rejection, and structure shift ensures that you enter only when the smart money has successfully taken control of the market.
One of the most challenging aspects of trading stop loss clusters is determining whether a move into a cluster will lead to a **reversal (exhaustion)** or a **continuation (breakout)**. When price enters a cluster, the triggering of stops represents a massive injection of market buy or sell orders. If a cluster of buy stops is triggered, it creates a flood of buy orders. If institutional traders use this flood of buy orders to sell their own positions, the upward momentum is immediately absorbed, resulting in exhaustion and a subsequent market reversal.
However, if there is genuine, strong institutional buying behind the move, the injection of retail buy stops will act as "fuel" for the trend. In this scenario, the market makers do not match the stops to sell; instead, the stops push the price even higher, leading to an explosive breakout. To determine which scenario is occurring, you must watch the price close relative to the cluster level. If the price breaks the cluster, closes strongly past it, and begins using the old cluster level as support, the cluster has fueled a breakout.
To mitigate risk during breakouts, always analyze the macroeconomic context and volume profiles. For instance, a cluster sweep that occurs during a low-volatility session (like the late Asian session) is highly likely to result in a reversal. On the other hand, a cluster sweep that happens during major high-impact news events (such as Non-Farm Payrolls or central bank rate decisions) is more likely to trigger a massive breakout continuation as institutional orders flow in alignment with the fundamental catalyst.
Professional traders rarely trade stop loss clusters in isolation. To maximize win rates, they combine stop clusters with other high-probability tools from Smart Money Concepts (SMC) and volume analysis. The three most powerful confluences to look for are:
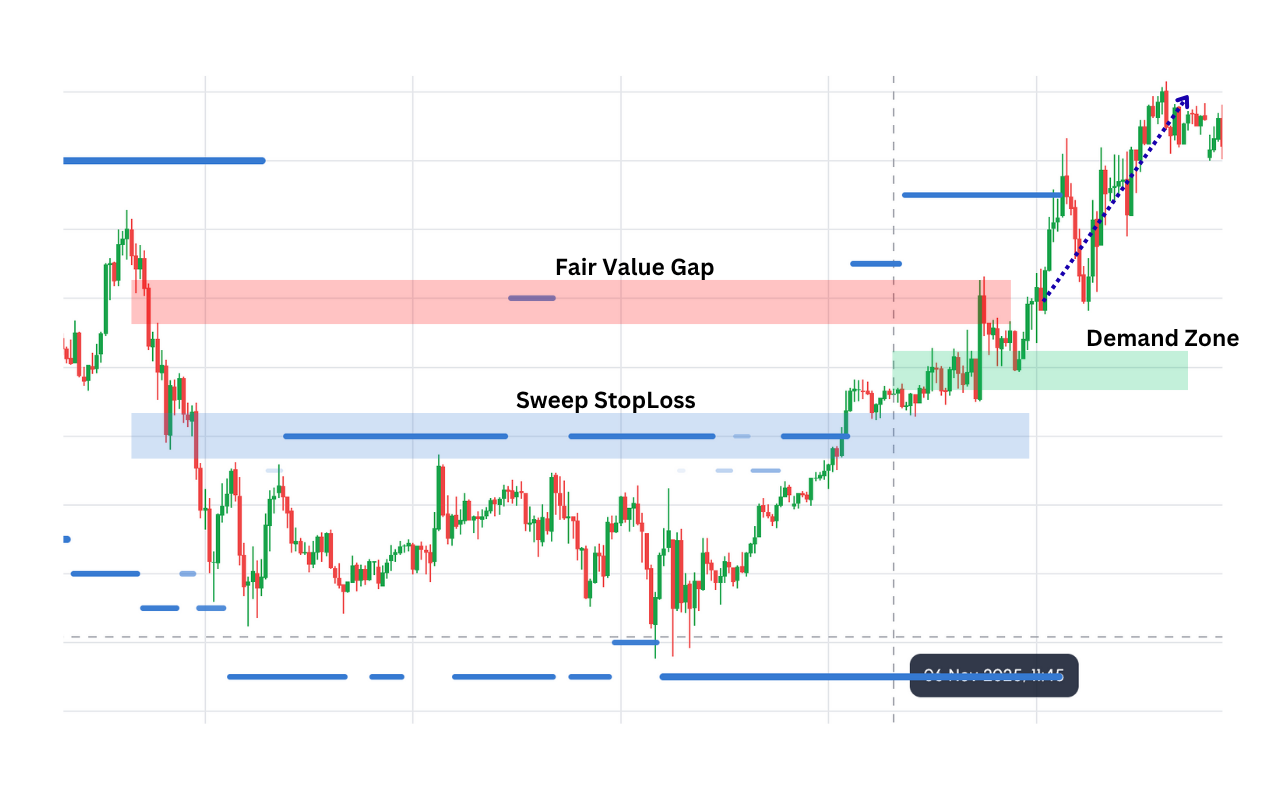
- Order Blocks (OB): Order blocks represent price zones where institutions have previously placed large block orders. When a stop loss cluster is located directly above or below a high-timeframe order block, it increases the likelihood of a reversal. Price will sweep the retail stops, tap into the order block to mitigate the institutional orders, and immediately reverse.
- Fair Value Gaps (FVG): A Fair Value Gap represents an imbalance in price delivery where only one side of the market was active. The market naturally seeks to fill these imbalances. If a stop loss cluster resides inside or just beyond an FVG, price will aggressively target the cluster to fill the imbalance and trigger the stops simultaneously, offering an excellent risk-to-reward entry point.
- Volume Profile (VPOC): The Volume Point of Control (VPOC) represents the price level where the highest volume was traded over a given period. If a stop cluster sits at a high-volume node or near a value area boundary, it acts as a strong support or resistance wall, enhancing the probability of a rejection after the stops are swept.
By lining up these three factors, you transform the Stop Loss Cluster Indicator from a simple visual map into a core part of a high-probability trading model. When a sweep candle rejects a cluster, mitigates an order block, fills a fair value gap, and reacts off a volume node, the probability of a successful reversal is at its highest.
Time of day is one of the most critical elements in trading liquidity pools. Stop loss clusters do not get swept randomly; they are targeted when market volatility and institutional volumes are highest. The trading day is divided into three major sessions: Asian, London, and New York. Institutional liquidity raids are heavily concentrated around session transitions and openings.
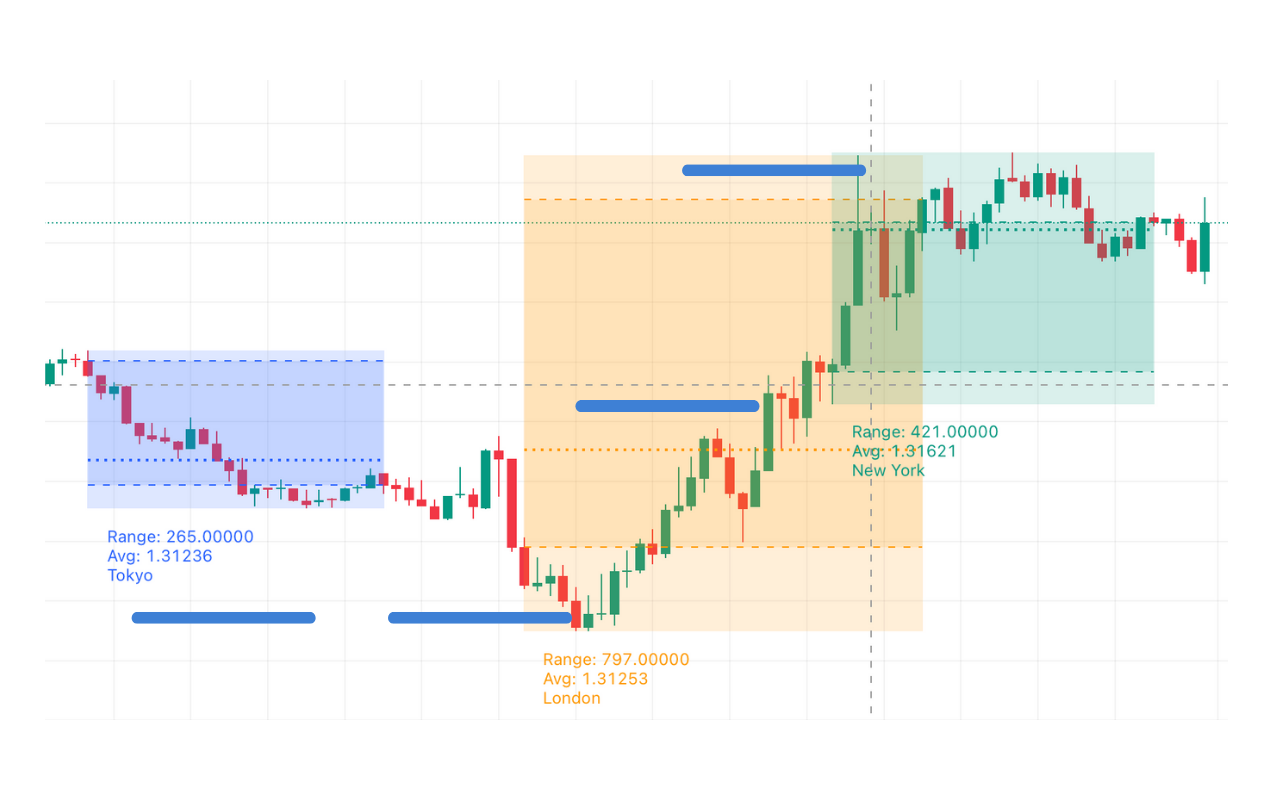
During the Asian session, trading volumes are generally low, and currency pairs trade within a tight range. This consolidation causes retail traders to place their stop losses just above and below the Asian range high and low. As the London session opens, institutional volume pours in. Market makers will often drive the price up to sweep the Asian range high (triggering retail buy stops) and then drive it immediately down to sweep the Asian range low (triggering retail sell stops). This double-sided sweep clears out the early retail participants, providing the necessary liquidity for the true London trend to establish.
Similarly, the New York session opening brings a massive wave of USD-driven volatility. Often, early moves in the New York session will sweep clusters established during the London session before reversing. Swing traders must pay close attention to these session-boundary sweeps, as they frequently print the high or low of the day, offering the tightest risk-to-reward ratio entries.
While stop loss clusters offer powerful trade locations, trading them carries inherent risks. Because liquidity sweeps represent highly volatile moments in the market, failure to manage risk can lead to devastating account drawdowns. A liquidity hunt can turn into a massive breakout trend if major news catalysts occur, driving price straight through your entry level without looking back.
To preserve capital, you must implement strict positioning rules. First, never enter a trade simply because price has touched a stop loss cluster. You must wait for the candle to close and confirm the rejection. Second, always place your own stop loss slightly beyond the high or low of the sweep candle. If the price breaks past the sweep candle\'s extreme, it invalidates the reversal thesis, and you must exit immediately.
Additionally, customize your position sizing to account for increased volatility. During high-impact news releases or session openings, spreads can widen, and slippage can occur. By keeping your risk per trade low (typically 0.5% to 1% of your account capital) and targeting the opposite liquidity cluster for your take profit, you build a mathematically robust trading model that can withstand session noise and capitalize on smart money sweeps.
