
Waddah Attar Explosion Indicator for MT4: Settings & Guide
 By RaptozGroup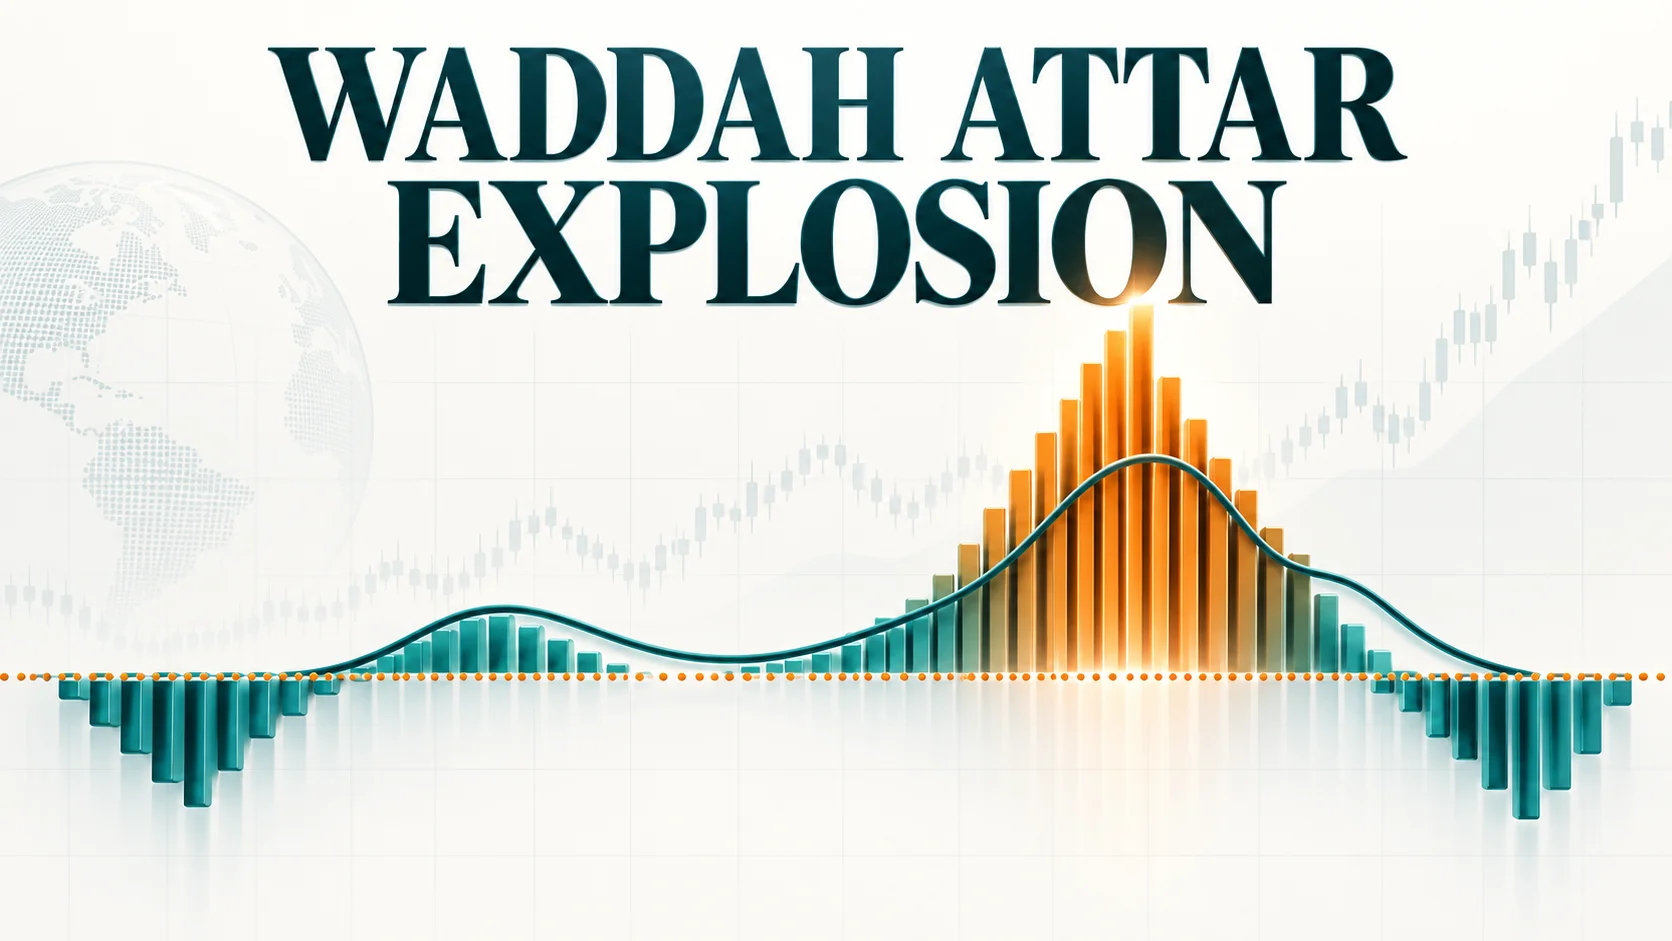
Read Waddah Attar Explosion momentum bars, the explosion line, and the dead-zone filter, with settings and MetaTrader installation guidance.
What is the Waddah Attar Explosion indicator?
Waddah Attar Explosion is a custom indicator that compares momentum with a volatility threshold. Its histogram, explosion line, and dead-zone filter are used to separate stronger directional movement from small fluctuations. Despite the name, it does not identify a future price explosion with certainty.
How the calculation works
The original family of implementations combines changes in MACD-related momentum with Bollinger-band-width information. Histogram colour separates directional readings, while the explosion line and dead zone supply thresholds. Later adaptations may use different sensitivity scales or ATR-based dead zones, so settings cannot be transferred blindly between versions.
What this guide covers
Waddah Attar Explosion settings on MT4
These are the actual inputs and defaults in RaptozGroup version 1.00. Other implementations may differ. Defaults are starting points, not optimized trading recommendations.
Change in fast-minus-slow EMA multiplied by sensitivity, compared with Bollinger width and an ATR dead zone. Both directional histograms are positive. This version uses an ATR-based dead zone, not a fixed pip value.
| Parameter | Default | What it changes |
|---|---|---|
| FastEMA / SlowEMA | 20 / 40 | Fast and slow close-price EMA periods. |
| Sensitivity | 150 | Multiplier for the change in EMA difference. |
| BandPeriod / BandDeviation | 20 / 2.0 | Population standard deviation of closing prices; explosion line is the full band width. |
| ATRPeriod | 100 | Wilder ATR period for the dead zone. |
| DeadZoneATR | 3.7 | ATR multiplier; a new threshold-clearing condition can trigger an alert. |
| EnablePopupAlerts | false | Optional terminal popup, once per newly closed signal candle; no historical alert on attachment. |
| EnablePushAlerts | false | Optional mobile push; configure Notifications in your terminal first. |
Signal examples & trade planning
Confirm the threshold units
Before comparing Forex and Gold charts, check whether the dead zone is expressed in points, pips, or a volatility-based value.
Read bars and thresholds together
A coloured bar on its own is not the complete condition. Compare its height with the relevant threshold and read the version's signal definition.
Compare with an actual price breakout
Look for a price structure event as context. A large histogram bar after an extended candle can also reflect a late move.
Watch what follows
Record failed breakouts and fading momentum as well as sustained moves. A smaller following bar does not necessarily mean price has reversed.
Worked interpretation
Imagine a bullish histogram bar rising above the explosion line while also clearing the dead zone. This is evidence of the indicator's momentum condition. If price immediately returns inside the previous range, the breakout has still failed; the oscillator does not invalidate that price evidence.
These examples explain indicator readings. They are not live signals or evidence of a profitable strategy. Include spread, commission, slippage, and losing setups in any evaluation.
Signal timing, repainting & limitations
Broker data, spread spikes, and instrument point size can influence comparisons. Very large bars can arrive late in a move. Alerts, smoothing, and threshold formulas differ between ports, so historical screenshots are not a compatibility test.
To inspect a version, record its signals at candle close, then refresh the chart and compare those same timestamps. Repeat with enough history loaded. If a higher timeframe is used, check whether that candle is still open. Passing a few examples is not a guarantee that all historical signals are stable.
Waddah Attar Explosion vs MACD histogram
A conventional MACD histogram shows the difference between MACD and its signal line. Waddah Attar adds its own momentum scaling and volatility thresholds, so identical-looking bars need not mean the same thing.
Free Waddah Attar Explosion download for MT4
Waddah Attar Explosion · MT4
RaptozGroup · Version 1.00 · Free source and compiled files
Choose the compiled file to install directly, or download the editable source for MetaEditor. No DLLs, external indicators, or automated order execution.
Native compilation and automated calculation checks completed. Demo-chart validation is still recommended. Warm-up bars are hidden; current-candle curves can change. Alerts default to off and use closed candles.
How to install a compatible version on MT4
Download the MT4 file above. The compiled .ex4 file is ready to install; the .mq4 source can be opened and compiled in MetaEditor.
- Open the MT4 desktop terminal and select File → Open Data Folder.
- Copy the
.mq4source or.ex4compiled file into MQL4 → Indicators. - For MQL4 source, open it in the MT4 MetaEditor and compile it. Resolve compiler errors before attempting to attach it.
- Refresh the Navigator or restart the terminal, then attach the indicator to a demo chart.
- Check the Inputs, Colors, and Visualization tabs. Compare the plotted output and signal timing with the implementation's documentation.
- Start on a standard MT4 timeframe such as M15 or H1. Custom or offline charts may need additional support from the indicator.
If the indicator does not appear
Confirm the platform and folder, load more chart history, and inspect the Experts and Journal logs. Check whether a separate indicator window opened below the chart. Missing dependencies or compiler errors need fixing in the actual file; changing its extension will not resolve them.
Implementation references
Review the implementation before installing
The linked material is a third-party reference, not a Trader Sentiments-tested download. Check its platform and licence. A TradingView example illustrates the concept but requires a separate MQL implementation for MetaTrader.
Waddah Attar Explosion — MQL5 Code Base referenceWaddah Attar Explosion MT4: frequently asked questions
What is the explosion line?
It is a volatility-related threshold used alongside the momentum histogram. Its exact calculation depends on the implementation.
Can I use the same dead-zone value on every symbol?
Not necessarily. A fixed point-based setting can mean very different distances across instruments. Check the units and symbol quotation format first.
Does Waddah Attar Explosion repaint?
There is no universal answer for every version. A current-candle value can change before close. Check whether closed-bar signals remain unchanged after refreshing the chart, and whether any higher-timeframe inputs are still forming. This page does not certify a specific implementation as non-repainting.
Can I use an MT5 file in MT4?
No. Use a native .mq4 source file or .ex4 compiled file for MT4. Renaming the file extension does not convert the code.
Can I install it in the MT4 mobile app?
Custom MQL indicators require the desktop terminal. The mobile app does not load custom .mq4 or .ex4 files. A desktop implementation may send push notifications if it supports them.
What is included in the download?
Free RaptozGroup source and compiled indicator files, version 1.00. Native compilation and automated calculation checks were completed. Broker-specific chart behavior and strategy profitability have not been validated. Test the indicator on a demo chart before relying on it.