
Traders Dynamic Index Indicator for MT4: TDI Settings & Guide
 By RaptozGroup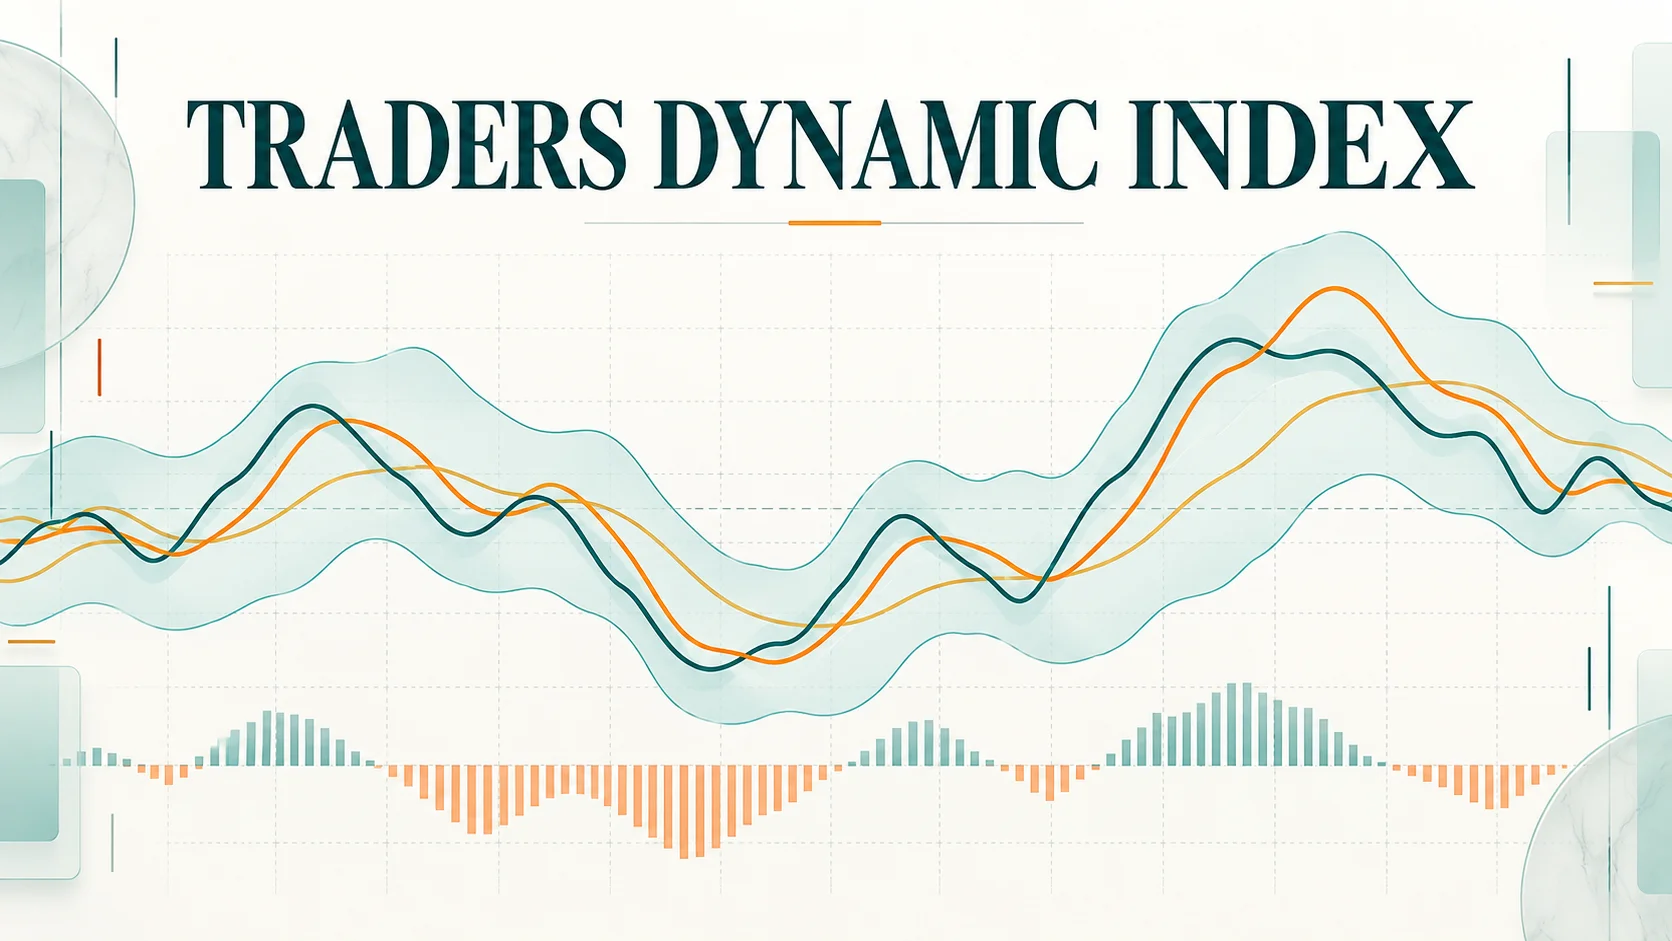
Understand TDI's RSI price line, signal line, market baseline, and volatility bands, with practical settings and MetaTrader setup guidance.
What is the Traders Dynamic Index indicator?
Traders Dynamic Index, often shortened to TDI, combines RSI-derived momentum lines and volatility bands in one indicator window. The layered display can help separate a short-term crossover from the broader momentum background. It is a custom combination of calculations rather than a direct measure of institutional order flow.
How the calculation works
A typical TDI plots a smoothed RSI price line, a slower trade signal line, a market baseline, and upper and lower volatility bands. Green, red, and yellow are common colours, but they are not a reliable substitute for the indicator legend. Different ports may calculate or smooth these lines differently.
What this guide covers
Traders Dynamic Index settings on MT4
These are the actual inputs and defaults in RaptozGroup version 1.00. Other implementations may differ. Defaults are starting points, not optimized trading recommendations.
Wilder RSI with simple moving averages for price and signal lines. The market baseline and population-standard-deviation bands are calculated on raw RSI. Alerts use closed-candle price-line/signal-line crosses.
| Parameter | Default | What it changes |
|---|---|---|
| RSIPeriod | 13 | Wilder RSI lookback. |
| PriceSmoothing | 2 | SMA period for the RSI price line. |
| SignalSmoothing | 7 | SMA period for the trade signal line. |
| BandPeriod | 34 | Raw RSI window for the baseline and volatility bands. |
| BandDeviation | 1.618 | Standard-deviation multiplier for the RSI bands. |
| EnablePopupAlerts | false | Optional terminal popup, once per newly closed signal candle; no historical alert on attachment. |
| EnablePushAlerts | false | Optional mobile push; configure Notifications in your terminal first. |
Signal examples & trade planning
Identify every plotted line
Read the Inputs and Colors tabs to map the RSI price line, signal line, baseline, and bands. Do not assume the colours match another screenshot.
Separate trigger from context
A fast-line crossover is a different observation from the lines being above the baseline. Write down which conditions your setup actually needs.
Compare with price structure
Check whether the price chart supports the momentum reading. An oscillator crossing alone does not establish a breakout or a reversal.
Review a consistent sample
Keep the same candle-confirmation rule and settings while comparing trending and ranging periods. Record trading costs and invalidated setups.
Worked interpretation
A price-line cross above the signal line below the baseline can be an early momentum change. A similar cross above the baseline can occur during an established trend. Treat these as separate examples instead of assuming every green-over-red cross has the same meaning.
These examples explain indicator readings. They are not live signals or evidence of a profitable strategy. Include spread, commission, slippage, and losing setups in any evaluation.
Signal timing, repainting & limitations
The lines share an RSI foundation and are not independent confirmations. Multiple agreeing lines can therefore overstate confidence. Live-candle crosses can disappear, and an overbought reading is not an automatic sell signal.
To inspect a version, record its signals at candle close, then refresh the chart and compare those same timestamps. Repeat with enough history loaded. If a higher timeframe is used, check whether that candle is still open. Passing a few examples is not a guarantee that all historical signals are stable.
TDI vs QQE
Both are RSI-derived custom oscillators. TDI typically emphasizes signal lines, a baseline, and volatility bands; QQE emphasizes smoothed RSI and volatility-based trailing levels. Their crossover rules are not equivalent.
Free Traders Dynamic Index download for MT4
Traders Dynamic Index · MT4
RaptozGroup · Version 1.00 · Free source and compiled files
Choose the compiled file to install directly, or download the editable source for MetaEditor. No DLLs, external indicators, or automated order execution.
Native compilation and automated calculation checks completed. Demo-chart validation is still recommended. Warm-up bars are hidden; current-candle curves can change. Alerts default to off and use closed candles.
How to install a compatible version on MT4
Download the MT4 file above. The compiled .ex4 file is ready to install; the .mq4 source can be opened and compiled in MetaEditor.
- Open the MT4 desktop terminal and select File → Open Data Folder.
- Copy the
.mq4source or.ex4compiled file into MQL4 → Indicators. - For MQL4 source, open it in the MT4 MetaEditor and compile it. Resolve compiler errors before attempting to attach it.
- Refresh the Navigator or restart the terminal, then attach the indicator to a demo chart.
- Check the Inputs, Colors, and Visualization tabs. Compare the plotted output and signal timing with the implementation's documentation.
- Start on a standard MT4 timeframe such as M15 or H1. Custom or offline charts may need additional support from the indicator.
If the indicator does not appear
Confirm the platform and folder, load more chart history, and inspect the Experts and Journal logs. Check whether a separate indicator window opened below the chart. Missing dependencies or compiler errors need fixing in the actual file; changing its extension will not resolve them.
Implementation references
Review the implementation before installing
The linked material is a third-party reference, not a Trader Sentiments-tested download. Check its platform and licence. A TradingView example illustrates the concept but requires a separate MQL implementation for MetaTrader.
Traders Dynamic Index — EarnForex implementation referenceTraders Dynamic Index MT4: frequently asked questions
What do the green, red, and yellow lines mean?
They commonly represent the RSI price line, trade signal line, and market baseline. Verify the legend because colours and line definitions can vary by version.
Is TDI an order-flow or volume indicator?
Typical TDI implementations are based on RSI and related smoothing and bands. They do not reveal the market's complete order book or institutional positioning.
Does Traders Dynamic Index repaint?
There is no universal answer for every version. A current-candle value can change before close. Check whether closed-bar signals remain unchanged after refreshing the chart, and whether any higher-timeframe inputs are still forming. This page does not certify a specific implementation as non-repainting.
Can I use an MT5 file in MT4?
No. Use a native .mq4 source file or .ex4 compiled file for MT4. Renaming the file extension does not convert the code.
Can I install it in the MT4 mobile app?
Custom MQL indicators require the desktop terminal. The mobile app does not load custom .mq4 or .ex4 files. A desktop implementation may send push notifications if it supports them.
What is included in the download?
Free RaptozGroup source and compiled indicator files, version 1.00. Native compilation and automated calculation checks were completed. Broker-specific chart behavior and strategy profitability have not been validated. Test the indicator on a demo chart before relying on it.