
The triple top is one of the most reliable bearish reversal patterns in technical analysis, formed by three consecutive price peaks at approximately the same resistance level. Each failed attempt to break resistance weakens buying conviction further, setting the stage for a powerful downside reversal when price finally cracks the neckline. This guide covers pattern structure, psychology, entry techniques, risk management, and confirmation signals for trading the triple top effectively.
What is a triple top?
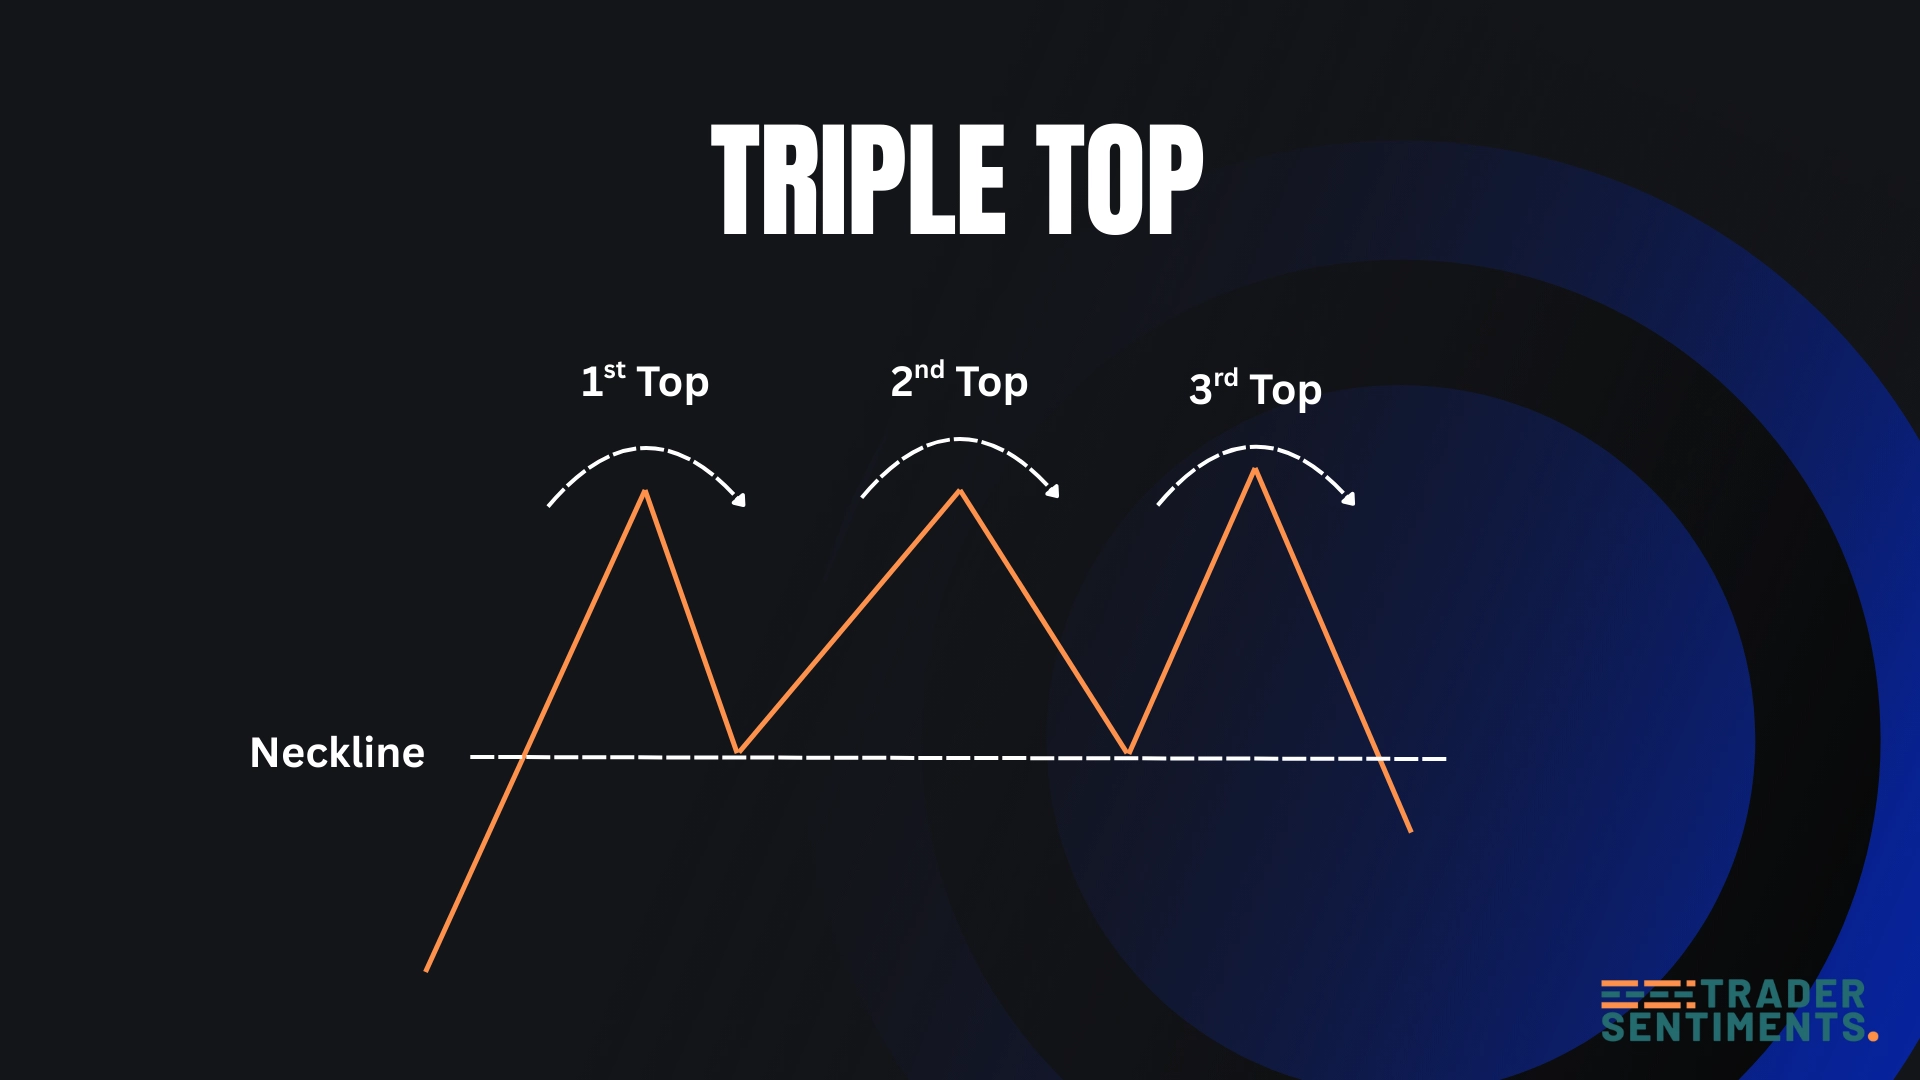
The triple top is a bearish reversal pattern consisting of three price peaks at approximately the same resistance level, separated by two troughs. It signals that buyers have made three determined attempts to break through resistance and failed each time, a clear sign of exhausted buying pressure and mounting seller control.
The triple top is considered more reliable than a double top because the resistance level has held three times. When price finally breaks below the neckline, the resulting decline can be swift and sustained, particularly when the breakdown is accompanied by strong volume on daily or weekly charts.
Pattern structure
- Prior uptrend: The pattern forms after a sustained advance, establishing the bullish context. A longer and stronger prior uptrend makes the eventual reversal more significant.
- First peak: Price rallies to a resistance level and reverses. Volume is often high. The move appears to be a normal pullback within the uptrend.
- First pullback: Price declines to a support level (the neckline) before buyers step back in and push price higher again.
- Second and third peaks: Price makes two more rallies to the same resistance level, failing to break above it each time. Volume typically decreases on each successive peak, showing weakening buying conviction.
- Neckline breakdown: Price breaks decisively below the neckline support on elevated volume, confirming the pattern and signaling the short entry.
How to identify
The three highs must be at approximately the same price level, within 1 to 2 percent is acceptable. A resistance level that has held exactly three times is the core defining feature.
The two troughs between the peaks should define a clear horizontal support level (the neckline). The flatter this line, the more textbook the pattern and the cleaner the eventual breakdown signal.
Volume should progressively decrease from peak one to peak three, showing diminishing buying enthusiasm and confirming buyers are running out of momentum at the resistance level.
The pattern is only confirmed when price closes below the neckline on strong volume. A breakdown on weak volume is suspect and has a significantly higher rate of reversal back above the neckline.
Psychology behind the pattern
The triple top illustrates a classic battle between buyers and sellers over a key price level. On the first peak, buyers push hard into resistance but sellers win, initially appearing as a normal pullback in what is still a healthy uptrend.
On the second attempt, buyers are optimistic, believing the first failure was temporary consolidation. But sellers defend the same level again. This second failure plants doubt in buyers' minds and reduces confidence in the uptrend.
By the third peak, buyers are running out of conviction. Volume is low because fewer participants believe price will break higher. When sellers successfully defend resistance for the third time, bullish sentiment collapses.
The neckline breakdown triggers a cascade: stop-loss orders from long traders fire, short sellers pile in, and institutions reduce exposure, creating the volume surge that validates the breakdown and accelerates the decline.
Timeframes and markets
Triple tops on weekly charts at major macro resistance levels are among the most powerful reversal signals. Daily chart patterns forming over 2 to 4 months at historically significant levels produce highly reliable short setups.
Four-hour chart triple tops at intraday key levels are regularly traded setups for active swing traders. The three peaks must be clearly defined with visible volume decline across them.
On hourly charts, noise increases and peaks become harder to distinguish. Only trade hourly triple tops at confluent support and resistance levels with multiple confirmation signals present.
Trading the pattern
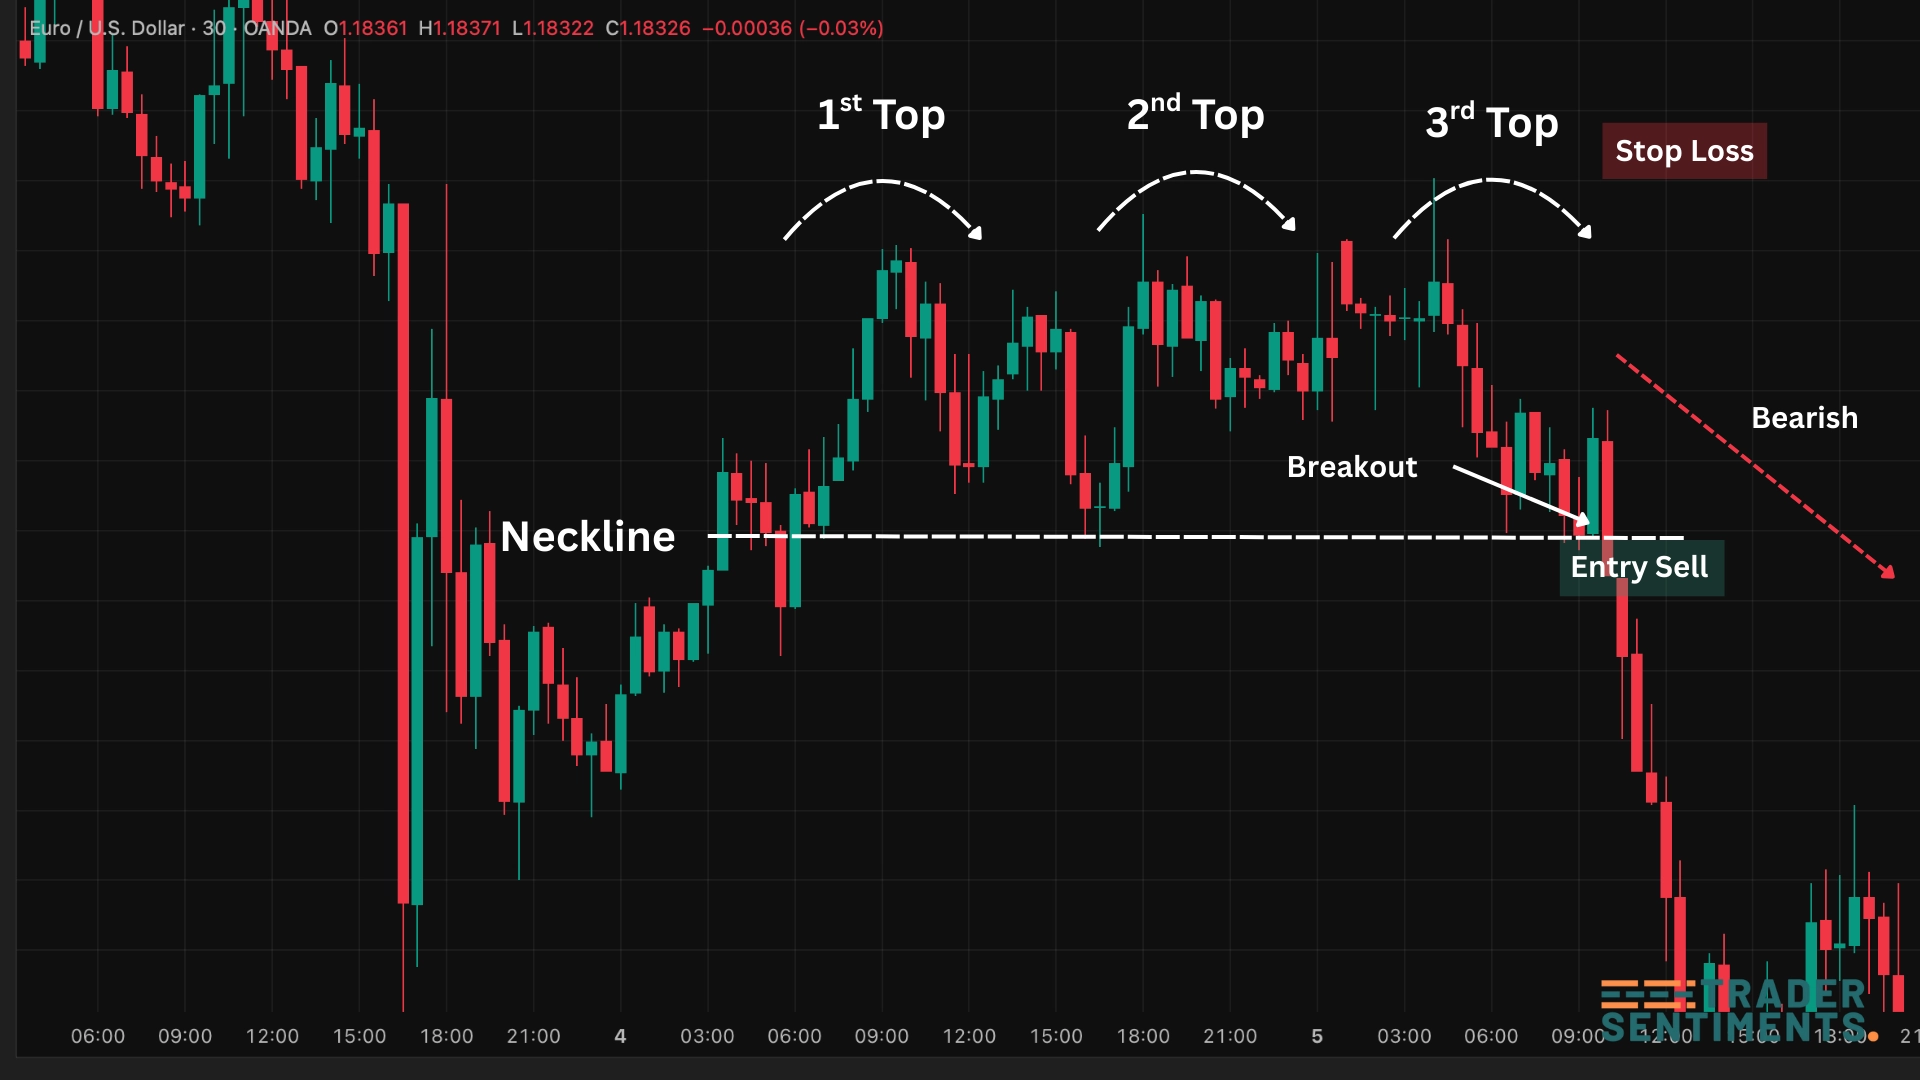
The triple top offers a high-probability short setup with well-defined risk parameters. The entry is taken on the neckline breakdown, the stop-loss is set above the three peaks, and the profit target is calculated using the measured move. The three-touch resistance level adds strong confidence that the reversal is genuine, making it one of the most trusted patterns in technical analysis.
Entry rules
- Neckline breakdown entry: Enter short when price closes below the neckline on a daily candle with above-average volume. This is the primary and most reliable entry method.
- Volume confirmation: The breakdown candle must show elevated volume, at least 1.5 times the recent average. Without volume, the breakdown may be a fakeout designed to trap shorts.
- Retest short entry: After the breakdown, price often retraces to test the neckline as new resistance. This retest offers a lower-risk secondary entry with a tighter stop above the neckline.
- Avoid shorting at the third peak: The pattern is unconfirmed until the neckline breaks. A third peak could still lead to a bullish breakout above resistance. Always wait for confirmation.
Stop-loss placement
Place the stop-loss above the highest of the three peaks. This is the safest placement, a bullish breakout above all three tops invalidates the pattern, but results in a wider stop requiring careful position sizing.
Place the stop-loss just above the neckline level, used when entering on a retest of the neckline after the initial breakdown. Provides a tighter risk-reward ratio but is more susceptible to stop-hunts.
Profit targets
Use the measured move technique: measure the vertical distance from the neckline up to the three peaks. Project that same distance downward from the neckline breakdown point.
For example: if the peaks are at $100 and the neckline is at $85 (height = $15), the profit target is $85 minus $15, equaling $70. Many traders take partial profits at 50 percent of the target and trail the stop on the remainder to capture extended moves.
Confirmation signals
The clearest confirmation: volume drops on each successive peak, then surges on the neckline breakdown. This volume profile perfectly captures the battle between buyers and sellers over the resistance level.
RSI making lower highs across the three price peaks while price makes equal highs confirms weakening momentum, a powerful early warning signal before the neckline breakdown occurs.
MACD losing upward momentum and crossing below its signal line as the third peak forms indicates the broader trend momentum is shifting from bullish to bearish.
Pre-identifying strong support levels below the neckline helps plan partial profit targets and understand how far the breakdown move may extend before finding buying interest.
Common mistakes
The most common mistake. Until the neckline breaks, the triple top is unconfirmed. Markets can and do break resistance after a third test. Always wait for the confirmed neckline breakdown before shorting.
A low-volume neckline breakdown is a major red flag. Without volume to sustain the move, prices frequently recover above the neckline, triggering stop-losses on short positions.
If one peak is significantly higher or lower than the others, the pattern loses its equal-resistance signal. True triple tops have peaks within 1 to 3 percent of each other.
Triple tops in strongly bullish market environments have a higher rate of failure. The broader market trend should always be considered before taking aggressive short positions based on a single pattern.
What invalidates the pattern
- Price breaks above all three peaks with strong volume, the resistance is broken and the uptrend likely continues. Exit any short positions immediately.
- Price holds above the neckline after breaking below and closes back above it, the breakdown has failed (bear trap) and the setup is invalidated.
- The three peaks are not at similar levels, if the third peak is significantly higher than the first two, the formation may be an ascending triangle or continuation pattern instead.
- Strong positive catalyst such as a major earnings beat, M&A activity, or macro improvement can abort the pattern regardless of its technical structure.