Bollinger Bands (BB) are a volatility-based indicator built around a moving average and standard deviation. Traders use them to spot volatility squeezes, expansion phases, potential breakouts, and mean-reversion zones. This guide explains how Bollinger Bands work, common settings (20,2), how to read the bands, and practical rules-based strategies with risk management.
The key idea is simple: volatility changes. When volatility is low, the bands contract. When volatility rises, the bands expand. That expansion is why Bollinger Bands are commonly used to frame squeeze → breakout phases and to define range edges for mean reversion.
Bollinger Bands explained
Bollinger Bands consist of three lines:
- Middle Band: a moving average (commonly 20-period SMA)
- Upper Band: middle band + (standard deviation × multiplier)
- Lower Band: middle band − (standard deviation × multiplier)
The distance between the upper and lower bands is not fixed. It expands and contracts based on how volatile price is. This makes Bollinger Bands helpful for spotting:
- Low-volatility compression (squeeze)
- High-volatility expansion (trend or breakout)
- Overextension zones in ranges (mean reversion context)
- Momentum “band-walks” during strong trends
How Bollinger Bands are calculated
Bollinger Bands use a moving average plus standard deviation. Standard deviation measures how spread out prices are from the average. Higher deviation = higher volatility.
- Middle Band: 20-period SMA (default)
- Upper Band: SMA + (2 × standard deviation)
- Lower Band: SMA − (2 × standard deviation)
You don’t need to manually compute this to trade it, but knowing the logic matters: when price becomes more volatile, bands widen. When the market is calm, bands tighten.
Best settings (20,2) and variations
The standard Bollinger Bands setting is (20, 2). This is the most widely used across forex, indices, and equities, and it’s what most educational material assumes.
Balanced for general volatility analysis. Best baseline to start with.
Wider bands. Often used to reduce false touches in high-volatility markets.
Faster bands. More signals, but more noise and whipsaw risk.
Don’t optimize settings to the past. Pick one baseline (usually 20,2) and improve your entry rules, filters, and risk management.
How to read Bollinger Bands
Bollinger Bands are often misunderstood as “sell at the top band, buy at the bottom band.” That works sometimes in ranges, but it can fail badly in strong trends. Here are the key reads:
Widening bands show volatility is increasing. This is common during breakouts and trend legs.
Tight bands suggest the market is compressing. Compression often precedes expansion. This is the foundation of the “squeeze” idea.
In a strong trend, price may ride the upper band (uptrend) or lower band (downtrend). Fading those touches is a common beginner mistake.
The middle band (MA) often behaves like a dynamic mean. In trends, pullbacks frequently react around the middle band before continuation.
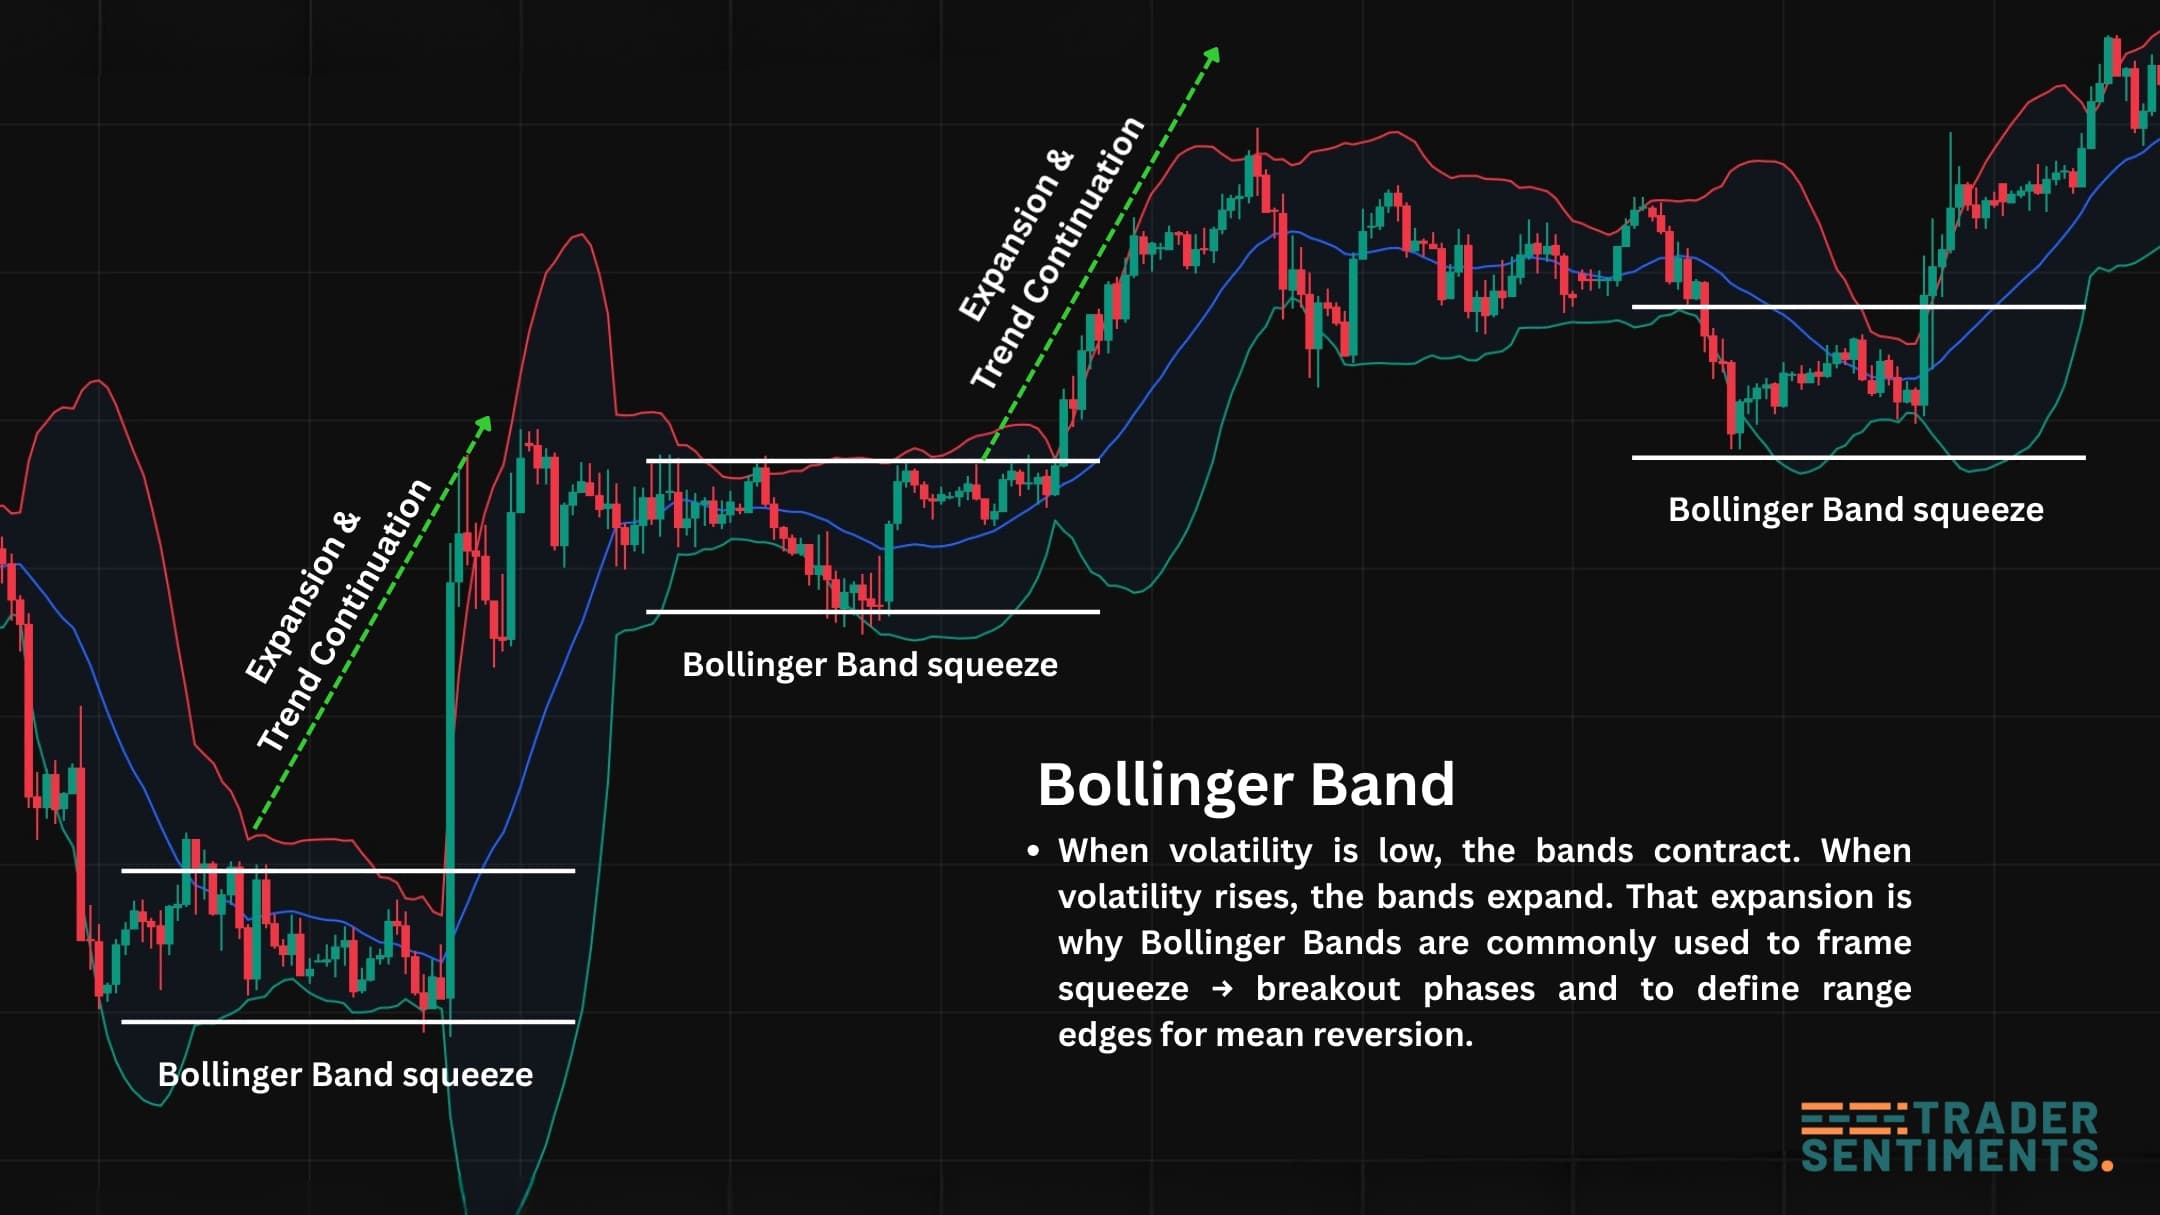
Example: band contraction → expansion and trend continuation.
Bollinger Band squeeze (volatility contraction)
A Bollinger Band squeeze is simply a period where the bands become unusually narrow. It signals low volatility and potential energy building up for a larger move.
- Identify compression (bands narrow for a sustained period)
- Wait for a clear close outside the bands
- Use structure confirmation (break of range high/low)
- Manage risk with a defined invalidation (back inside range)
The squeeze does not tell you direction by itself. Direction comes from price structure, breakout confirmation, and where liquidity is sitting.
Strategies: breakout and mean reversion
- Market: clear range + tight bands
- Trigger: close outside the band + break of range
- Entry: retest of breakout level or momentum continuation
- Stop: back inside the range (invalidation)
- Target: next key level or measured move
- Market: sideways range (structure confirms)
- Entry: fade outer band touches with rejection candle
- Target: middle band first, opposite band second
- Stop: outside range + no follow-through
- Filter: avoid trading band fades during strong expansion
In strong trends, price often pulls back toward the middle band. Traders look for a pullback into the middle band, then confirmation back in the trend direction. This combines trend logic with volatility context.
Risk management and common mistakes
Bollinger Bands can create lots of signals. The difference between a good BB trader and a losing one is usually filters and risk rules.
- Shorting upper band in strong uptrends (band-walk)
- Trading squeeze without breakout confirmation
- Ignoring major news volatility spikes
- Over-leveraging because “bands look safe”
- Higher-timeframe bias (trend vs range)
- Key support/resistance zones
- Session timing (avoid dead hours)
- Volatility awareness (avoid chaotic spikes)
- Risk a fixed % per trade (example: 0.5%–1%)
- Stops go where your setup is invalidated, not where it “feels safe”
- One clean setup is better than many random band touches
- Track costs (spread + slippage) in fast moves