The Relative Strength Index (RSI) is a momentum indicator that helps traders measure how strongly price is moving. This guide explains what the RSI indicator is, how it works, the relative strength index formula and calculation, and how to use RSI for trend confirmation, pullbacks, ranges, and divergence—without relying on indicator clutter.
If you only remember one rule: RSI is a momentum tool, not a magic reversal button. In strong trends, RSI can stay “overbought” or “oversold” longer than most traders expect. The best results come from combining RSI with structure (trend/range) and key levels.
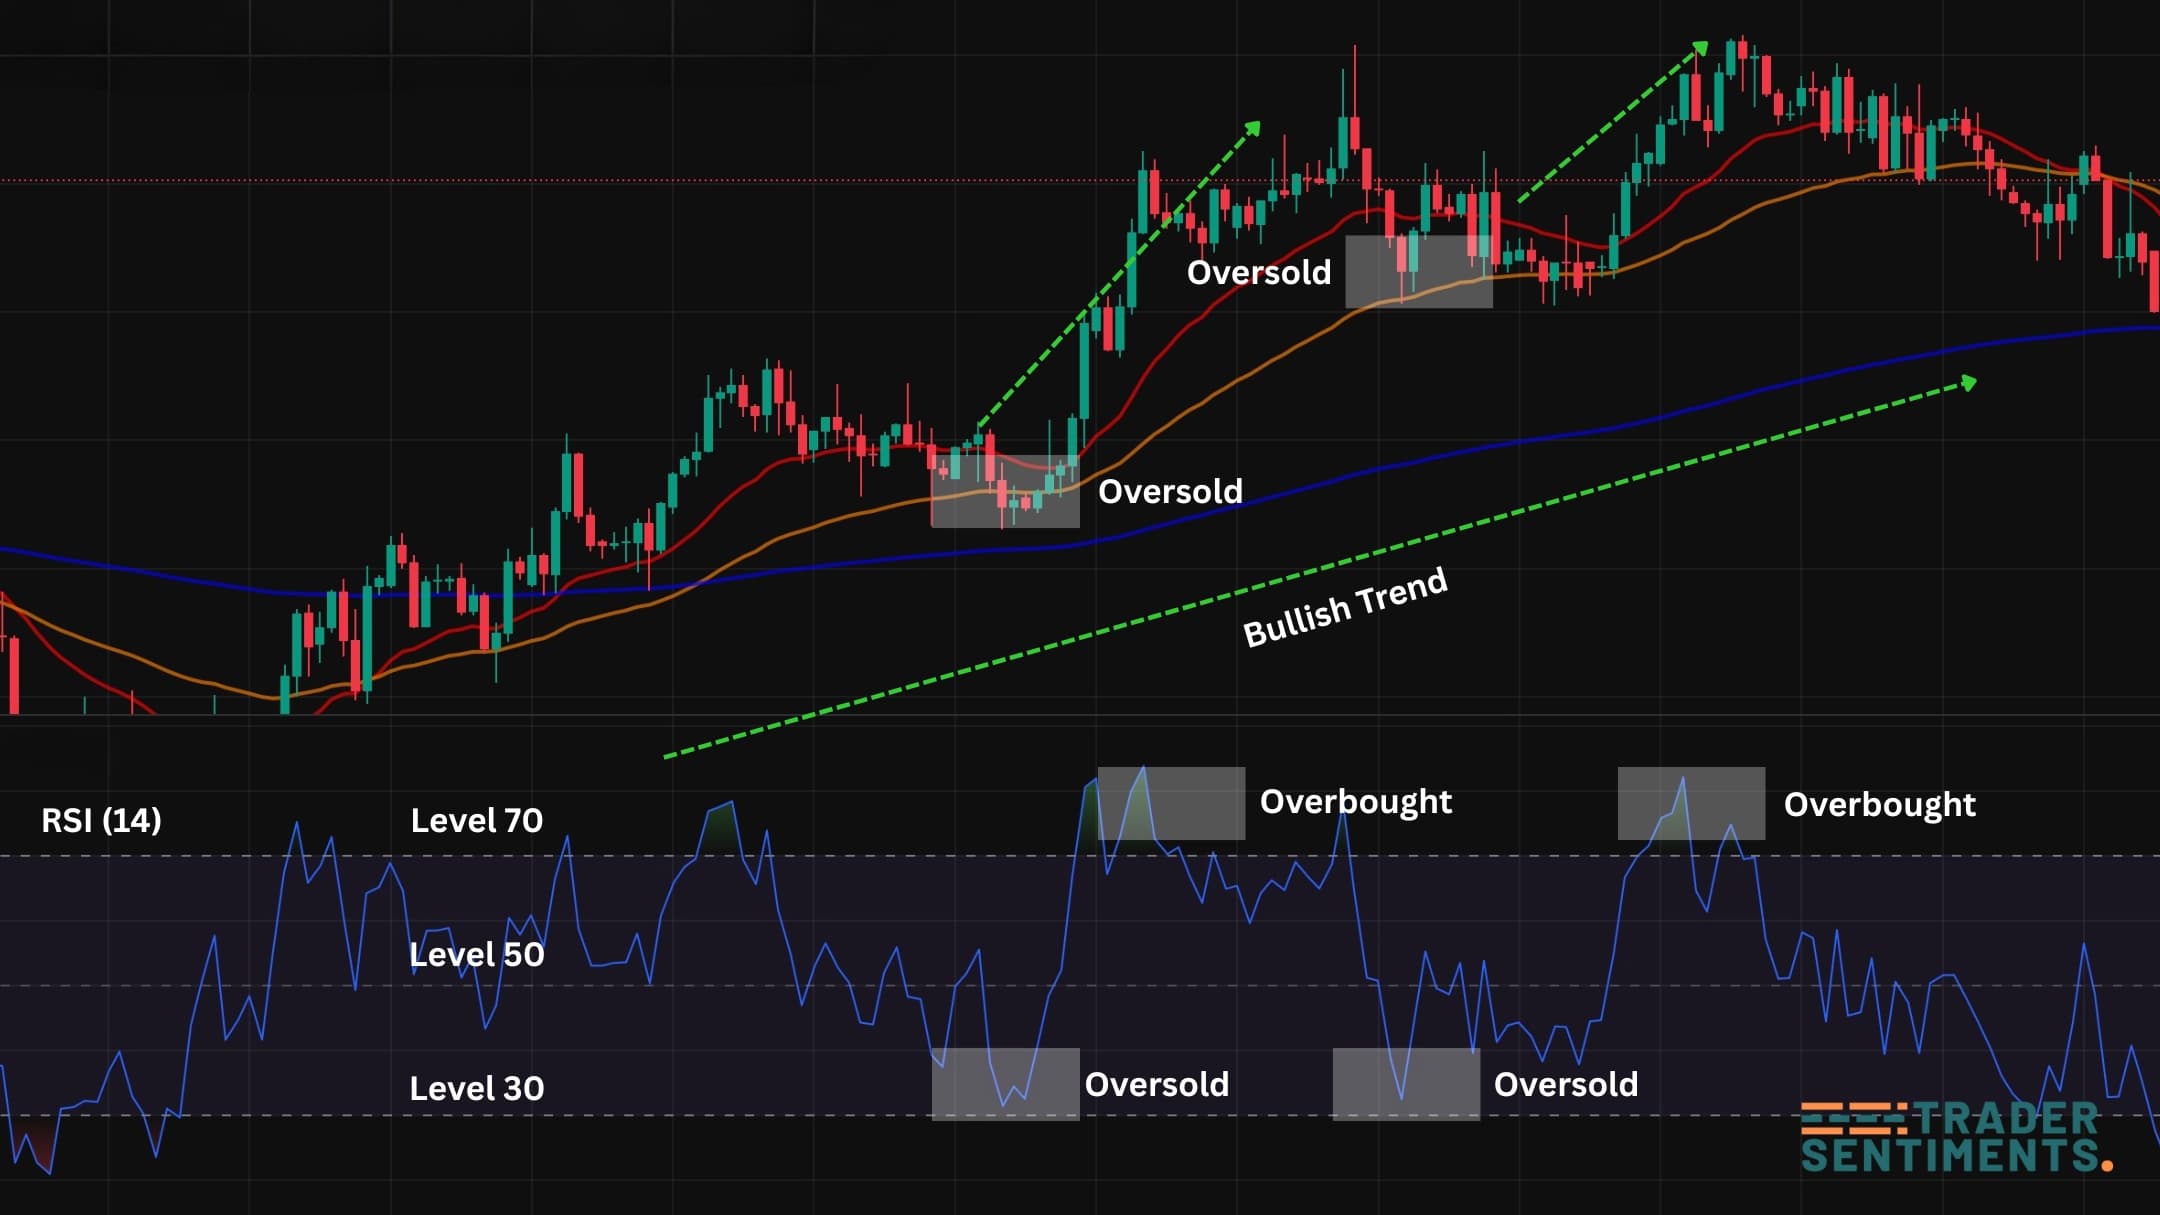
Example chart showing RSI behavior in trend and range.
What is the Relative Strength Index (RSI)?
The Relative Strength Index (RSI) is a popular momentum indicator developed to measure how strongly price has been moving over a recent window (most commonly 14 periods). It converts price momentum into a single line that oscillates between 0 and 100.
- Spot momentum strength (is the move accelerating or weakening?)
- Identify potential range extremes (overbought/oversold in sideways markets)
- Confirm trend direction using the 50 level (momentum midline)
- Detect divergence (price vs momentum disagreement)
How RSI works (momentum explained)
RSI compares the average size of recent up-closes to the average size of recent down-closes. When recent gains dominate, RSI rises. When recent losses dominate, RSI falls.
This is why RSI is called a momentum oscillator: it does not predict direction by itself—it describes the current “push” behind price movement.
- RSI often holds above 50
- Pullbacks may dip toward 40–50 then bounce
- Overbought can mean “strong”, not “reverse now”
- RSI often holds below 50
- Rallies may stall around 50–60 then drop
- Oversold can mean “strong bearish momentum”
Relative Strength Index formula
The relative strength index formula is:
Where RS = (Average Gain over N periods) / (Average Loss over N periods).
Most platforms calculate RSI automatically. You do not need to manually compute it to trade it, but knowing what’s inside the indicator helps you interpret it correctly.
RSI calculation (simple walkthrough)
RSI uses a lookback period (commonly 14). Over that window:
- Separate up moves (gains) and down moves (losses).
- Compute the average gain and average loss.
- Compute RS = average gain / average loss.
- Convert RS into RSI using the RSI formula.
RSI rises when recent candles have stronger closes to the upside, and falls when recent candles have stronger closes to the downside. That’s why RSI is useful for spotting momentum shifts before a trend visibly “looks broken.”
How to read the RSI indicator (30/70 + 50 level)
RSI is usually interpreted using three simple reference areas: the 30/70 zones and the 50 level.
Often called overbought. In strong uptrends, it can stay high for long periods.
Often called oversold. In strong downtrends, it can stay low for long periods.
Momentum midline. Above 50 is typically bullish momentum; below 50 is bearish.
The biggest upgrade most traders can make is to treat RSI 50 as a trend filter: use 30/70 for context, not automatic reversal entries.
How to use RSI in trend vs range
RSI behaves differently in trending and ranging conditions. If you don’t adjust your expectations, you’ll get “false signals” that are actually normal behavior.
- Use 50 as a bias line (above = bullish, below = bearish)
- Look for pullbacks where RSI dips and then reclaims 50
- Don’t short just because RSI hits 70 in an uptrend
- Use 30/70 near support/resistance for mean-reversion ideas
- Confirm with structure (range boundaries)
- Take profits faster (ranges don’t trend far)
RSI trading strategies (rules-based)
- Context: Higher timeframe trend up (structure or moving average filter)
- Pullback: RSI dips below 50 during a correction
- Trigger: RSI reclaims 50 + price shows bullish structure
- Stop: Below pullback swing
- Target: Previous high / next resistance
- Context: Price is ranging between clear support and resistance
- Buy idea: RSI near 30 at support + rejection
- Sell idea: RSI near 70 at resistance + rejection
- Stop: Beyond range boundary
- Target: Mid-range first, then opposite boundary
A “failure swing” is when RSI fails to make a new high/low and then breaks a prior RSI swing level. Traders use it as a momentum confirmation, ideally at a key price level (not random).
RSI divergence (how to spot it)
RSI divergence happens when price and RSI disagree:
- Price makes a lower low
- RSI makes a higher low
- Signals weakening bearish momentum
- Price makes a higher high
- RSI makes a lower high
- Signals weakening bullish momentum
Divergence is strongest when it appears after an extended move and at a key level. If you trade every divergence you see, you’ll overtrade noise.
Best RSI settings (7/14/21) and when to use them
The default RSI period is 14, but traders adjust settings based on how fast they want RSI to react.
Faster, more signals, more noise. Useful for very short-term execution with strict filters.
Balanced. Works well for most traders on H1–D1 and is widely used (easier to learn).
Smoother, fewer signals. Better for higher-timeframe trend context and cleaner swings.
Keep one RSI setting consistent for at least a few weeks while you learn how it behaves on your market and timeframe. Constantly changing settings creates inconsistent decisions.
Common RSI mistakes & filters
- Reversal-only thinking: shorting every RSI 70 and buying every RSI 30 without context.
- Ignoring structure: RSI signals work best near real support/resistance and swing points.
- No trend filter: using RSI mean-reversion in strong trends (whipsaw risk).
- Over-optimizing settings: changing RSI periods constantly instead of improving rules.
- No risk rules: indicators do not replace position sizing and stop placement.
Helpful filters: higher-timeframe bias, key levels, session timing, avoiding major news spikes, and using RSI 50 as a trend confirmation line.