MACD (Moving Average Convergence Divergence) is a momentum indicator that shows the relationship between two moving averages. Traders use MACD to read momentum shifts, trend continuation, and potential reversals using the MACD line, signal line, histogram, and divergence. This guide explains MACD clearly with rules-based examples.
- Momentum shifts (is the move accelerating or weakening?)
- Trend continuation vs early warning of exhaustion
- Confirmation tool with structure and key levels
- Divergence signals (price vs momentum disagreement)
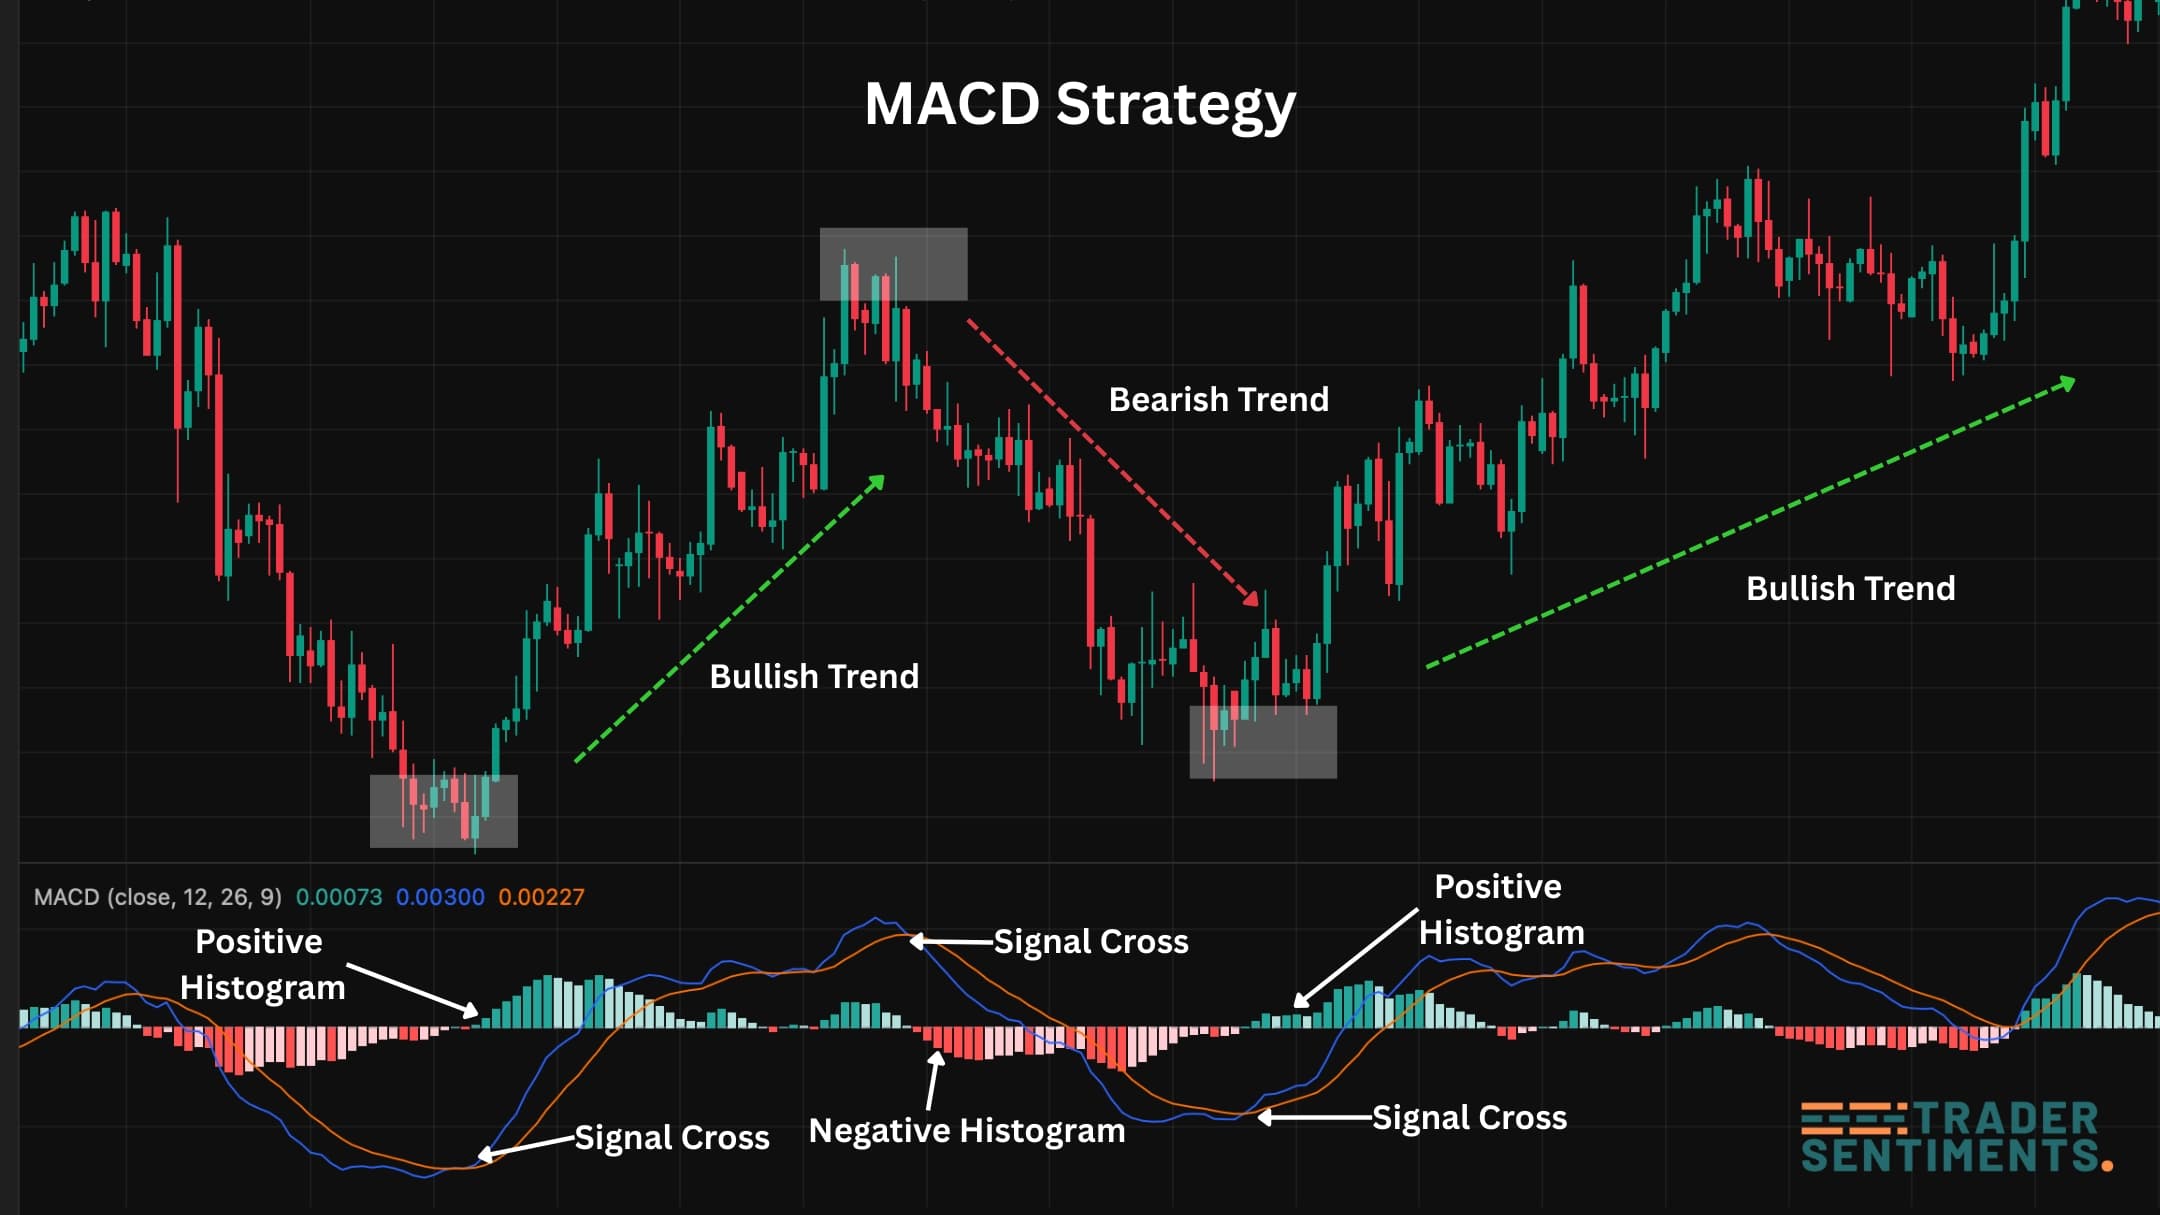
Example chart showing MACD line, signal line, and histogram.
What is MACD?
MACD stands for Moving Average Convergence Divergence. It measures momentum by comparing two moving averages (commonly 12 EMA and 26 EMA). The difference between them becomes the MACD line. A second line (the signal line) smooths MACD, and the histogram shows the distance between MACD and the signal line.
MACD is not a “buy/sell” button. It is a momentum dashboard: it shows when momentum is building, fading, or flipping direction.
How MACD works (convergence and divergence meaning)
“Convergence” and “divergence” describe whether the two moving averages are moving closer or farther apart. This is why MACD reflects momentum:
- Fast MA pulls away from slow MA
- MACD line moves away from zero
- Histogram bars expand
- Fast MA moves back toward slow MA
- MACD line drifts toward zero
- Histogram bars shrink
MACD line vs signal line vs histogram
The MACD line is the difference between two EMAs (commonly 12 EMA minus 26 EMA). It tracks the underlying momentum of price.
The signal line is a smoothed version of MACD (commonly a 9 EMA of the MACD line). Crossovers between MACD and signal line are common momentum signals.
The histogram shows the distance between MACD and the signal line. Expanding bars suggest rising momentum; shrinking bars suggest fading momentum.
How to read MACD (step-by-step)
- Start with the histogram: Are bars expanding (momentum increasing) or shrinking (momentum fading)?
- Check MACD vs signal line: Is MACD above (bullish momentum) or below (bearish momentum) the signal line?
- Use the zero line: Above zero usually means bullish bias; below zero means bearish bias.
- Confirm with price: Use structure and levels (support/resistance) to avoid trading signals in noise.
MACD is strongest when you trade it in the direction of higher-timeframe bias and use it as a confirmation tool, not a standalone entry trigger.
MACD crossover signals (bullish & bearish)
- MACD line crosses above the signal line
- Histogram flips from negative to positive (or rises)
- Best when near support or after a pullback in an uptrend
- MACD line crosses below the signal line
- Histogram flips from positive to negative (or drops)
- Best when near resistance or after a pullback in a downtrend
Crossovers in sideways markets can whipsaw. Add a filter: trade only when price is aligned with a trend filter (structure or moving averages) or when the zero-line context supports the direction.
MACD histogram signals (momentum shift)
The histogram often gives earlier information than line crossovers because it shows how quickly MACD is separating from (or converging toward) the signal line.
- Expanding bars: momentum combine/accelerate (trend continuation often stronger)
- Shrinking bars: momentum fading (possible pullback or consolidation)
- Histogram flip: bars switch side of zero (momentum bias change)
MACD divergence (how to spot it)
Divergence happens when price makes a new high/low but MACD does not confirm. It can signal weakening momentum and potential reversal or deeper correction.
- Price makes a lower low
- MACD/histogram makes a higher low
- Bear momentum weakening
- Price makes a higher high
- MACD/histogram makes a lower high
- Bull momentum weakening
Divergence is best used at key levels (support/resistance) or after extended moves. Avoid taking every divergence you see in the middle of noise.
How to use MACD in trend vs range
- Use zero line as bias: above = bullish, below = bearish
- Use pullback entries: histogram shrinks then expands again
- Prefer signals aligned with structure (higher highs / lower lows)
- Crossovers can whipsaw more
- Focus on extremes near support/resistance + divergence
- Take profits quicker; don’t expect long trends
Best MACD settings (12-26-9 and alternatives)
Default MACD settings are typically 12-26-9 (fast EMA, slow EMA, signal EMA). This works well as a general-purpose momentum measure.
Balanced. Good starting point for most markets/timeframes.
More responsive but noisier. Better with strict filters.
Smoother, fewer signals. Useful for higher timeframe context.
Choose one setting and stay consistent while building your rules. Over-optimizing settings usually produces inconsistent decisions.
MACD trading strategies (rules-based)
- Trend filter: price structure trending (or above/below a key MA)
- Pullback: histogram shrinks toward zero
- Trigger: histogram expands again in the trend direction
- Stop: beyond the pullback swing
- Target: previous high/low or next key level
- Buy only when MACD is above zero and crosses above signal
- Sell only when MACD is below zero and crosses below signal
- Avoid trades when MACD is flat around zero (chop)
- Risk: fixed % per trade with clear invalidation
- Context: extended move into major support/resistance
- Signal: price makes new extreme but MACD does not confirm
- Trigger: structure break or candle confirmation
- Target: mean reversion to key zone / mid-structure
Common mistakes & filters
- Trading every crossover: MACD can whipsaw in ranges.
- No context: ignoring trend/levels leads to low-quality signals.
- Late entries: entering after a big move when momentum is already extended.
- Ignoring risk: indicators don’t protect you from over-leverage.
- Chasing divergence: divergence is not a guaranteed reversal—confirm with price action.
Helpful filters: higher-timeframe bias, key support/resistance, session timing, avoiding major news spikes, and zero-line alignment for trend trades.