

Price action trading is a style focused on understanding market structure, support and resistance, and candlestick behavior. Instead of relying on many indicators, price action traders use clean charts to identify where price is likely to react and where a trade idea becomes invalid.
The goal is not to predict every candle. The goal is to build a simple, repeatable process: identify structure, mark key levels, wait for confirmation, then manage risk properly.
Price action explained
Price action trading focuses on what price is doing around key areas. Instead of reacting to indicators, you read the chart directly: trends, ranges, breakouts, and rejections.
- Market structure (trend vs range).
- Support and resistance zones.
- How candles react at key levels.
- Where a trade idea becomes invalid.
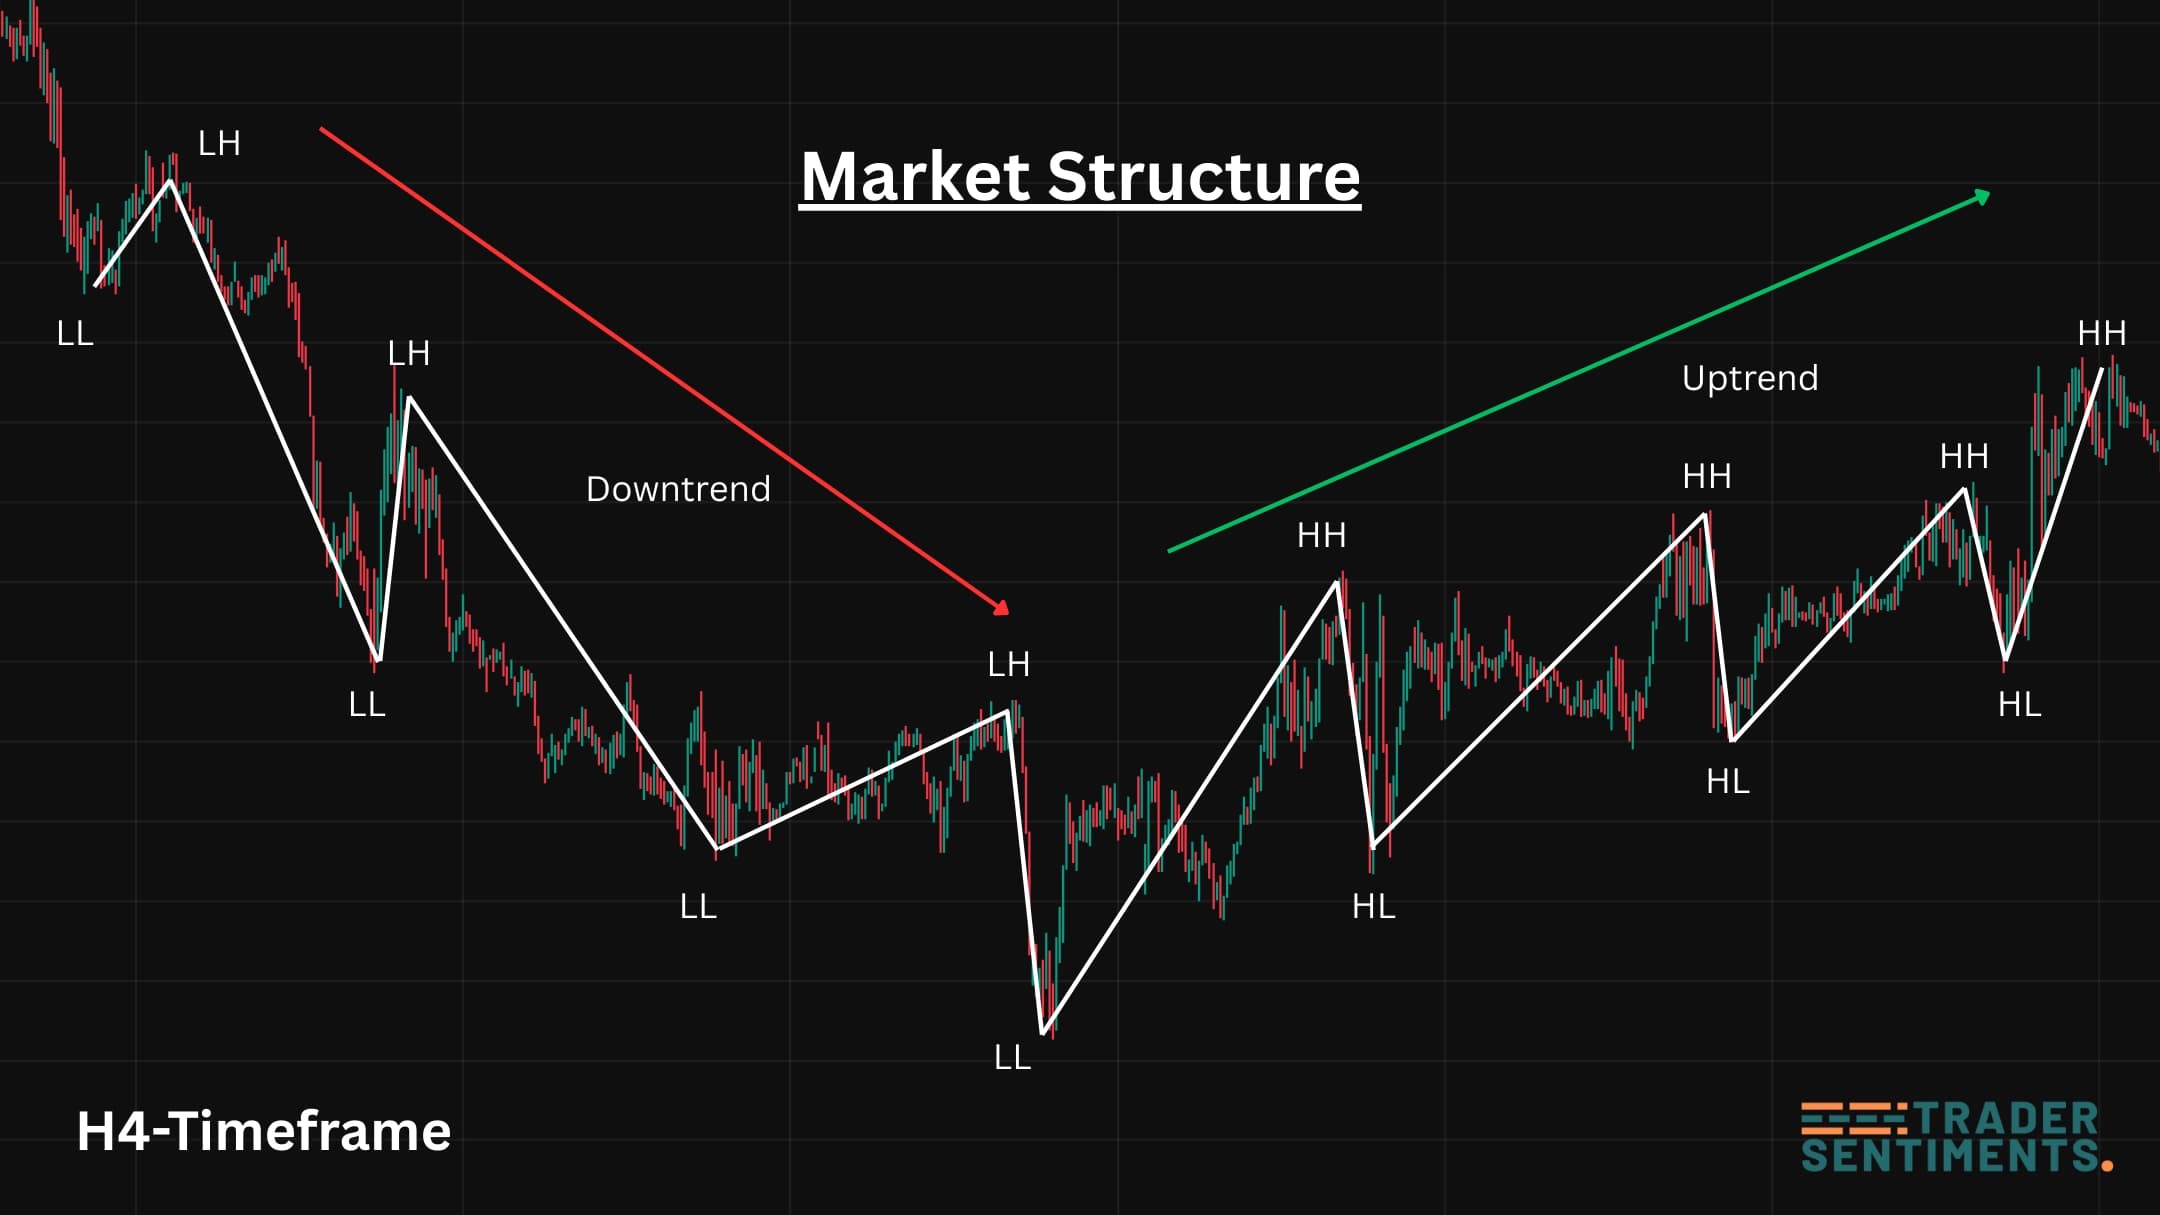
Market structure basics
Market structure is the backbone of price action. In an uptrend, you’ll often see higher highs (HH) and higher lows (HL). In a downtrend, you’ll see lower lows (LL) and lower highs (LH).
- HH + HL pattern holds
- Pullbacks respect prior support
- Breakouts hold above key levels
- LL + LH pattern holds
- Rallies fail below resistance
- Breakdowns hold below key levels
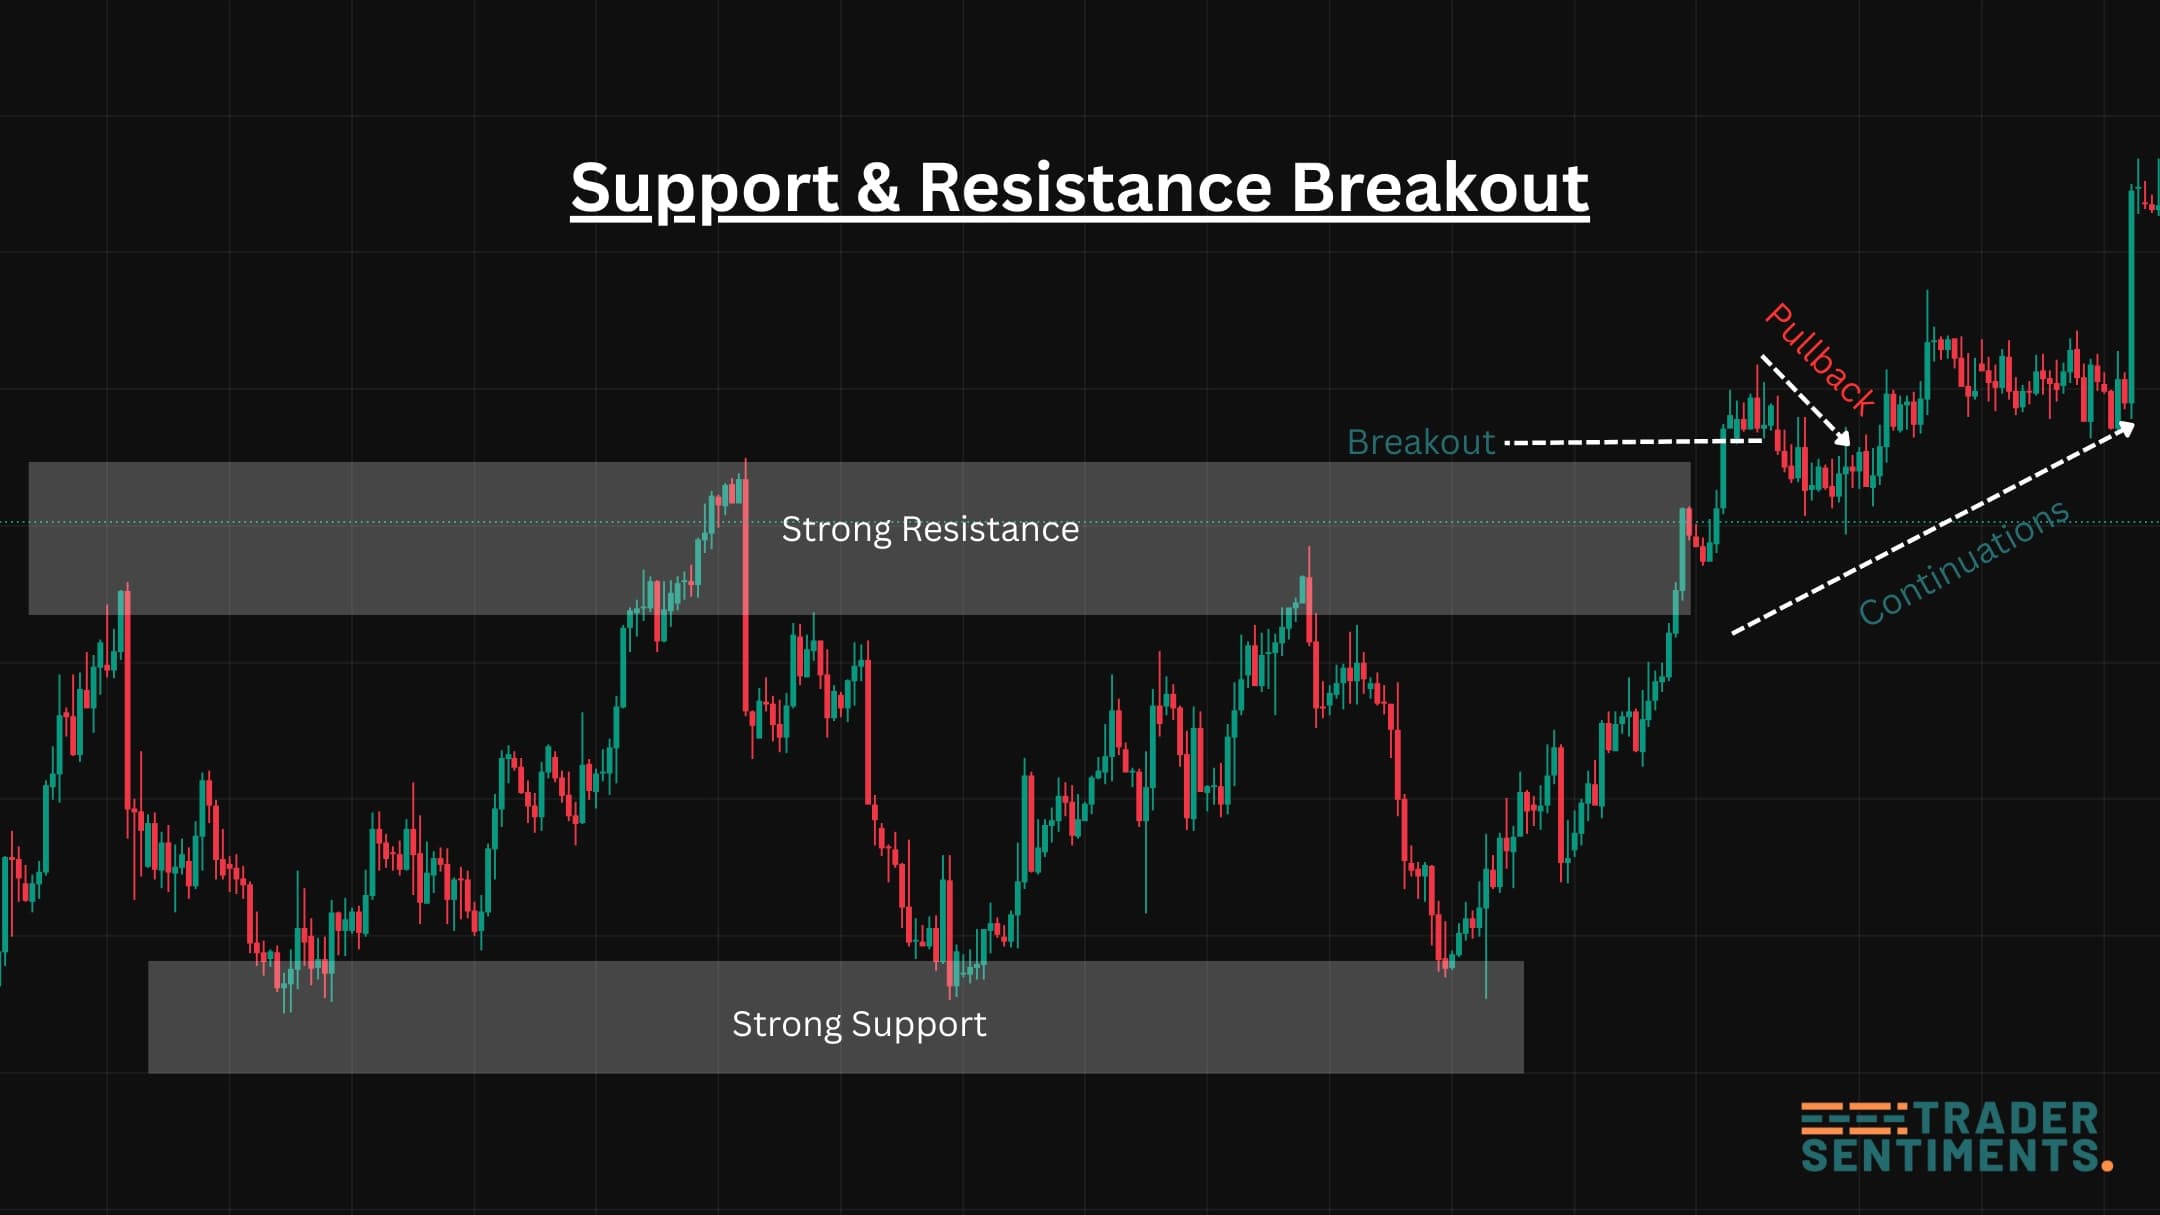
Support and resistance
Support and resistance are areas where price has reacted strongly before. Price action traders don’t treat levels as a single line — they treat them as a zone.
- Mark obvious swing highs/lows on H4/D1.
- Prefer levels with multiple reactions.
- Wait for confirmation (rejection, reclaim, break-and-hold).
- Avoid forcing trades in the middle of a range.
Candlestick signals
Candlesticks become meaningful when they form at important levels. A single candle pattern is not magic — it’s a clue about rejection, momentum, or indecision.
- Rejection wick: price tried to break, then snapped back.
- Engulfing candle: momentum shift after pullback.
- Consolidation: compression before breakout.
Building a price action strategy
A good price action strategy is a simple system you can repeat. The core is: direction → level → confirmation → risk → management.
- Pick timeframe: H4/D1 for structure, H1/M15 for entry.
- Define trend/range: use HH/HL or LH/LL structure.
- Mark key zones: S/R, prior highs/lows.
- Wait for confirmation: rejection, reclaim, break-and-hold.
- Set invalidation: stop beyond structure, not inside noise.
- Bias: H4 structure bullish.
- Zone: pullback into prior H4 support.
- Entry: bullish rejection candle closes above zone.
- Stop: below last swing low (invalidation).
- Target: next key resistance (or trail if trending).
Risk management approach
Risk management is what keeps price action trading consistent. Most traders use a fixed risk per trade (for example 0.5%–1%) and avoid widening stops after entry.
- Risk a fixed % per trade.
- Stops go beyond structure invalidation.
- Avoid stacking correlated positions.
- Journal outcomes to improve your process.