
The triple bottom is one of the most powerful bullish reversal patterns in technical analysis, formed when price tests the same support level three times without breaking lower. Each failed breakdown strengthens buyer conviction, and when price finally breaks above the neckline, it often triggers a significant and sustained upward move. This guide covers the complete structure, psychology, entry techniques, confirmation signals, and risk management for trading the triple bottom effectively.
What is a triple bottom?
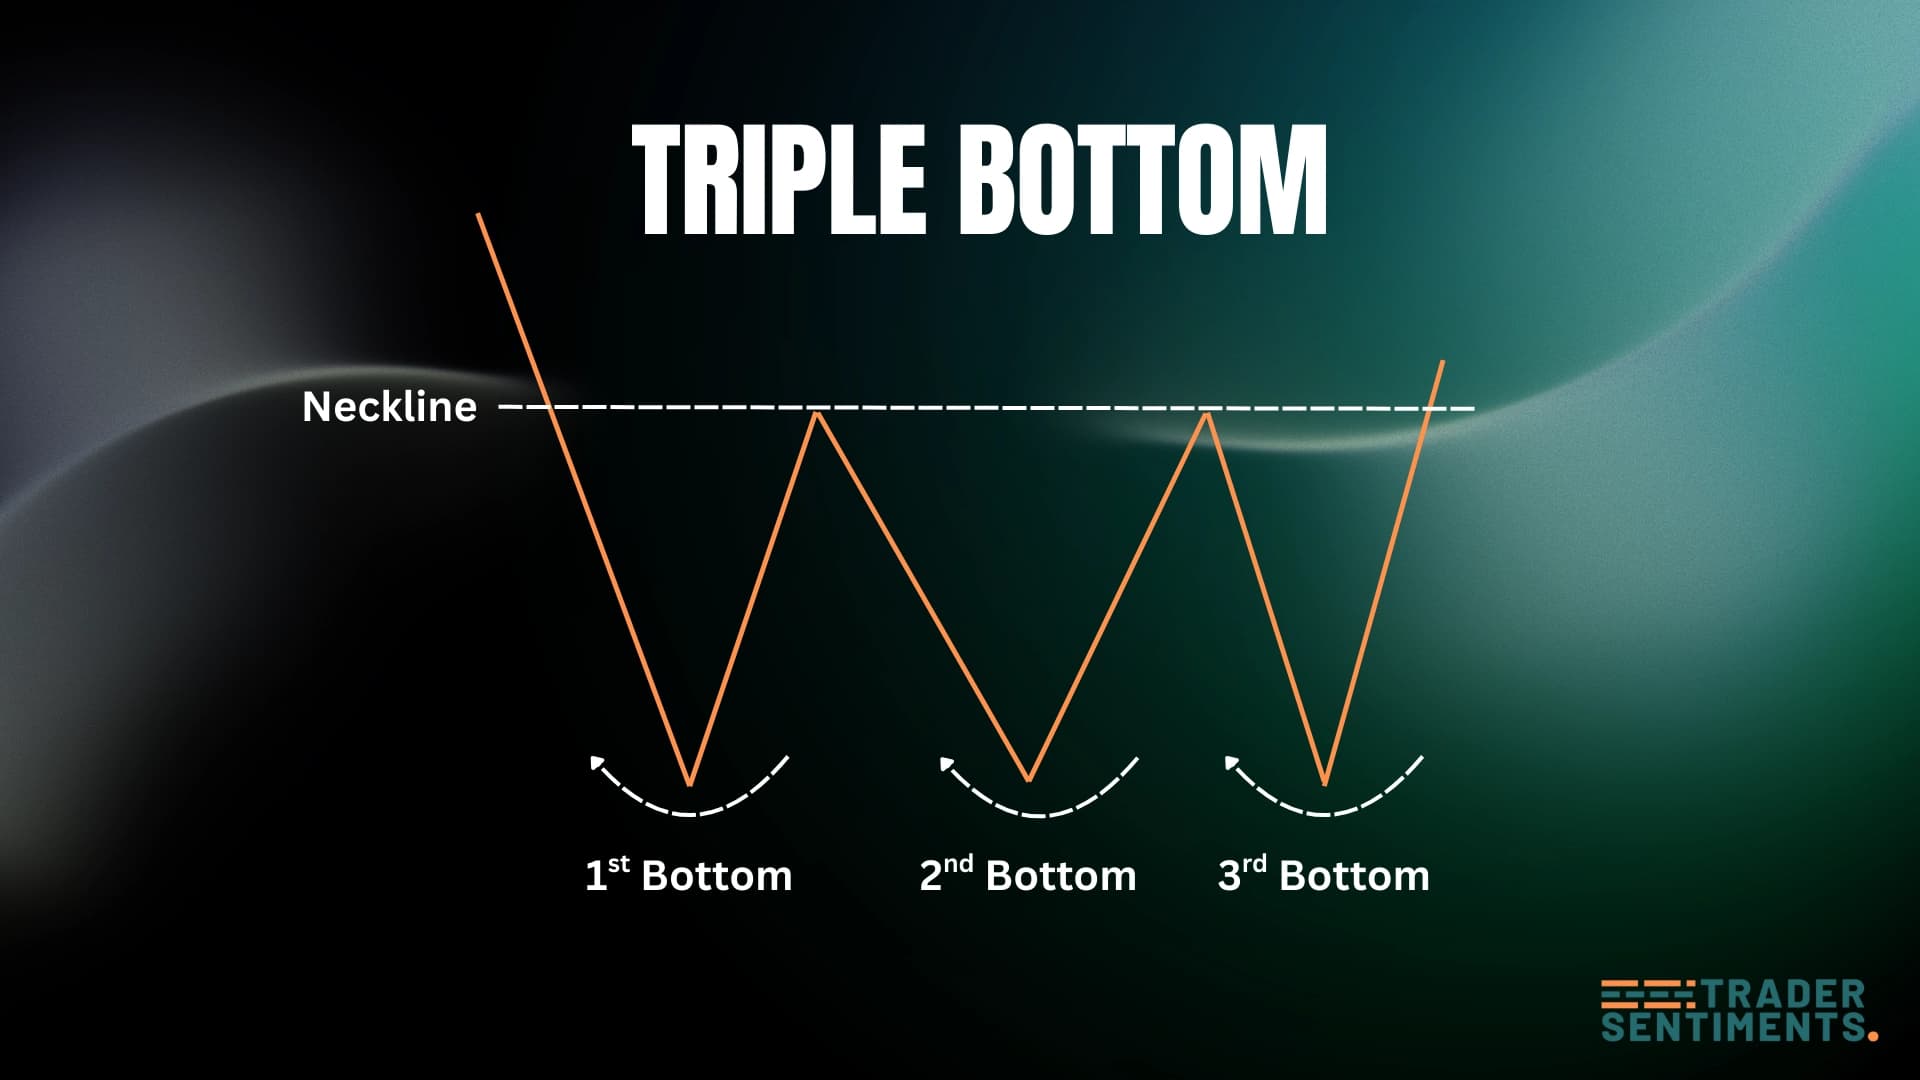
The triple bottom is a bullish reversal pattern consisting of three price lows at approximately the same support level. It signals that sellers have made three attempts to push price lower and failed each time, a clear sign of exhausted selling pressure and growing buyer confidence.
The triple bottom is considered more reliable than a double bottom because the support level has held three times. When price finally breaks above the neckline, the resulting move can be powerful and sustained, particularly when the pattern forms on daily or weekly charts after an extended downtrend.
Pattern structure
- Prior downtrend: The pattern forms after a sustained decline, establishing the bearish context that the triple bottom reverses.
- First low: Price declines to support and bounces. Volume is often elevated. The move appears to be a normal correction low within the downtrend.
- First recovery: Price rallies to the neckline resistance level before sellers push it back down.
- Second low: Price retests the same support area and holds again. Volume is typically lower, signaling diminishing selling pressure.
- Third low and breakout: Price makes one final descent to support, holds for the third time, often on the lowest volume of all three lows, then surges above the neckline on strong volume to confirm the pattern.
How to identify
The three lows must be at approximately the same price level, within 1 to 2 percent is acceptable. All three must touch the same clear support zone. One significantly lower low suggests a different pattern.
The two peaks between the three lows form a horizontal resistance level (the neckline). The flatter and more clearly defined this resistance, the more textbook and reliable the pattern.
Volume should progressively decrease from the first low to the third, showing that selling pressure is exhausting. A significant volume surge on the neckline breakout is the critical confirmation signal.
The triple bottom is only confirmed when price closes above the neckline on strong volume. A weak or low-volume breakout is far more likely to fail and return below the neckline.
Psychology behind the pattern
The triple bottom captures the transition of market sentiment from bearish to bullish. At the first low, sellers are dominant, the downtrend appears intact and most traders remain pessimistic. The bounce from support is seen as temporary.
At the second low, sellers try again but fail to push price below the established support. This failure plants doubt. Long-term buyers begin quietly accumulating at support, recognizing the value level and the repeated defense.
By the third low, sellers are exhausted. The volume on this third attempt is lowest of all, since very few sellers remain willing to push price lower against a support that has held twice. Smart money completes its accumulation phase.
When price finally breaks the neckline, a cascade of buy stops triggers, short sellers are forced to cover positions, and momentum traders join the move, producing the volume surge that validates the breakout and launches the new uptrend.
Timeframes and markets
Triple bottoms on weekly charts at major macro support levels are among the most powerful reversal signals. Daily chart patterns forming over 2 to 4 months are highly reliable, especially at historically significant price levels.
Four-hour chart triple bottoms at key intraday support levels are regularly traded by swing traders. The pattern requires clearly defined three lows with visible volume decline and a strong breakout candle above the neckline.
On hourly charts, false signals increase significantly. Only trade hourly triple bottoms at confluent support levels with multiple technical confirmation signals present simultaneously.
Trading the pattern
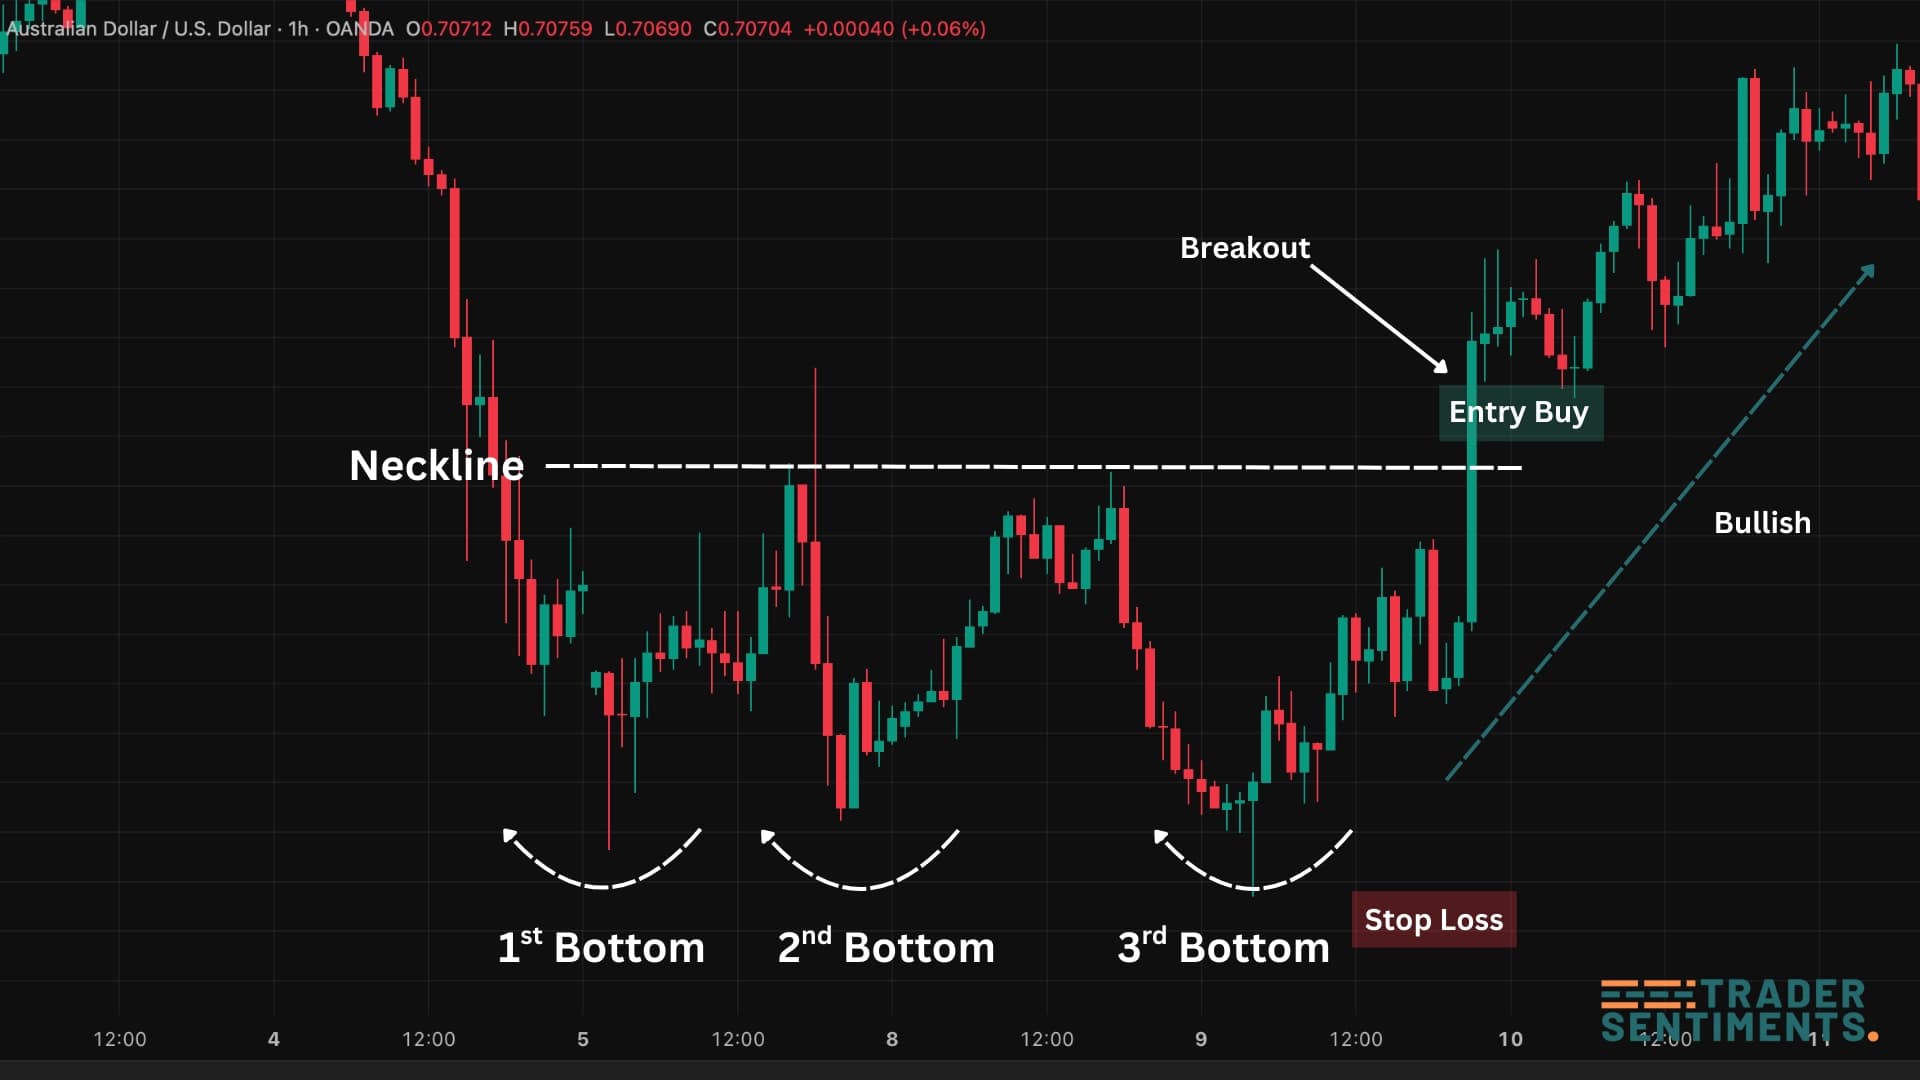
The triple bottom is a high-confidence long setup with well-defined risk parameters. Entry is taken on the neckline breakout, the stop-loss is placed below the three equal lows, and the profit target is calculated using the measured move from the neckline. Three touches of support make this a more reliable signal than a double bottom, and patient traders who wait for the confirmed breakout are rewarded with a favorable risk-to-reward ratio.
Entry rules
- Neckline breakout entry: Enter long when price closes above the neckline on a daily candle with above-average volume. This is the primary and most reliable entry method.
- Volume confirmation: The breakout candle must show elevated volume. Without volume, the breakout may be a fakeout and price could return below the neckline.
- Retest long entry: After the neckline breaks, price often pulls back to retest the neckline as new support. This retest offers a lower-risk second entry point with a tighter stop below the neckline.
- Avoid buying at the third low: The pattern is unconfirmed until the neckline breaks. A third touch of support could still lead to a bearish breakdown. Always wait for the confirmed neckline breakout.
Stop-loss placement
Place the stop-loss below the lowest of the three price lows. This is the safest placement, the entire support level must fail to invalidate the trade, but requires careful position sizing.
Place the stop-loss just below the neckline after entering on a neckline retest. Provides a much tighter risk-reward ratio but requires precise timing and is more susceptible to stop hunts.
Profit targets
Use the measured move technique: measure the vertical distance from the neckline down to the three lows (the depth of the pattern), then project that same distance upward from the neckline breakout point.
For example: if the neckline is at $60 and the lows are at $45 (a $15 range), the profit target is $60 + $15 = $75. Experienced traders take partial profits at 50% of the target and trail the stop on the remainder to capture extended moves.
Confirmation signals
The clearest confirmation: volume decreases on each successive low, then surges decisively on the neckline breakout. This volume profile perfectly captures the exhaustion of sellers and the emergence of buyers.
RSI making higher lows while price makes equal lows across the three bottoms is a powerful leading indicator showing improving momentum before the visible neckline breakout occurs.
MACD turning upward and crossing above its signal line while still below zero provides an early signal of the momentum shift from bearish to bullish before the neckline is reached.
Price reclaiming key moving averages, particularly the 50-day moving average, around the time of the neckline breakout adds confirmation that the trend is reversing on a broader basis.
Common mistakes
The most common and costly mistake. Until the neckline breaks, the triple bottom is unconfirmed. Markets routinely break below established support zones on a fourth test. Always wait for the confirmed neckline breakout before entering.
A neckline breakout on declining or flat volume is a red flag for a false breakout. Strong volume is the single most important confirmation signal for a valid triple bottom breakout.
If one low is significantly lower than the others, the pattern loses its equal-support signal and may be a different formation. Valid triple bottoms have lows within 1 to 3 percent of each other.
Triple bottoms in strongly bearish market environments have a higher failure rate. Always consider the broader market trend and macro backdrop before committing to the trade.
What invalidates the pattern
- Price breaks below all three lows with strong volume, the support level has failed and the downtrend likely continues. Exit any long positions immediately.
- Price fails to hold above the neckline after breaking above it and closes back below, the breakout has failed (bull trap) and the setup is invalidated.
- The three lows are at significantly different levels, if each low is noticeably lower than the previous, the pattern may be a descending channel or continuation, not a triple bottom.
- Strong negative catalyst such as a major earnings miss, credit downgrade, or macro shock can override any technical reversal pattern and cause support to fail.