
The symmetrical triangle is a neutral continuation pattern formed by two converging trendlines, a descending upper trendline and an ascending lower trendline, that compress price into a narrowing coil. Unlike ascending or descending triangles, the symmetrical triangle does not favor either direction until the breakout occurs. This guide covers everything traders need to know about identifying, timing, and managing risk when trading the symmetrical triangle breakout.
What is a symmetrical triangle?
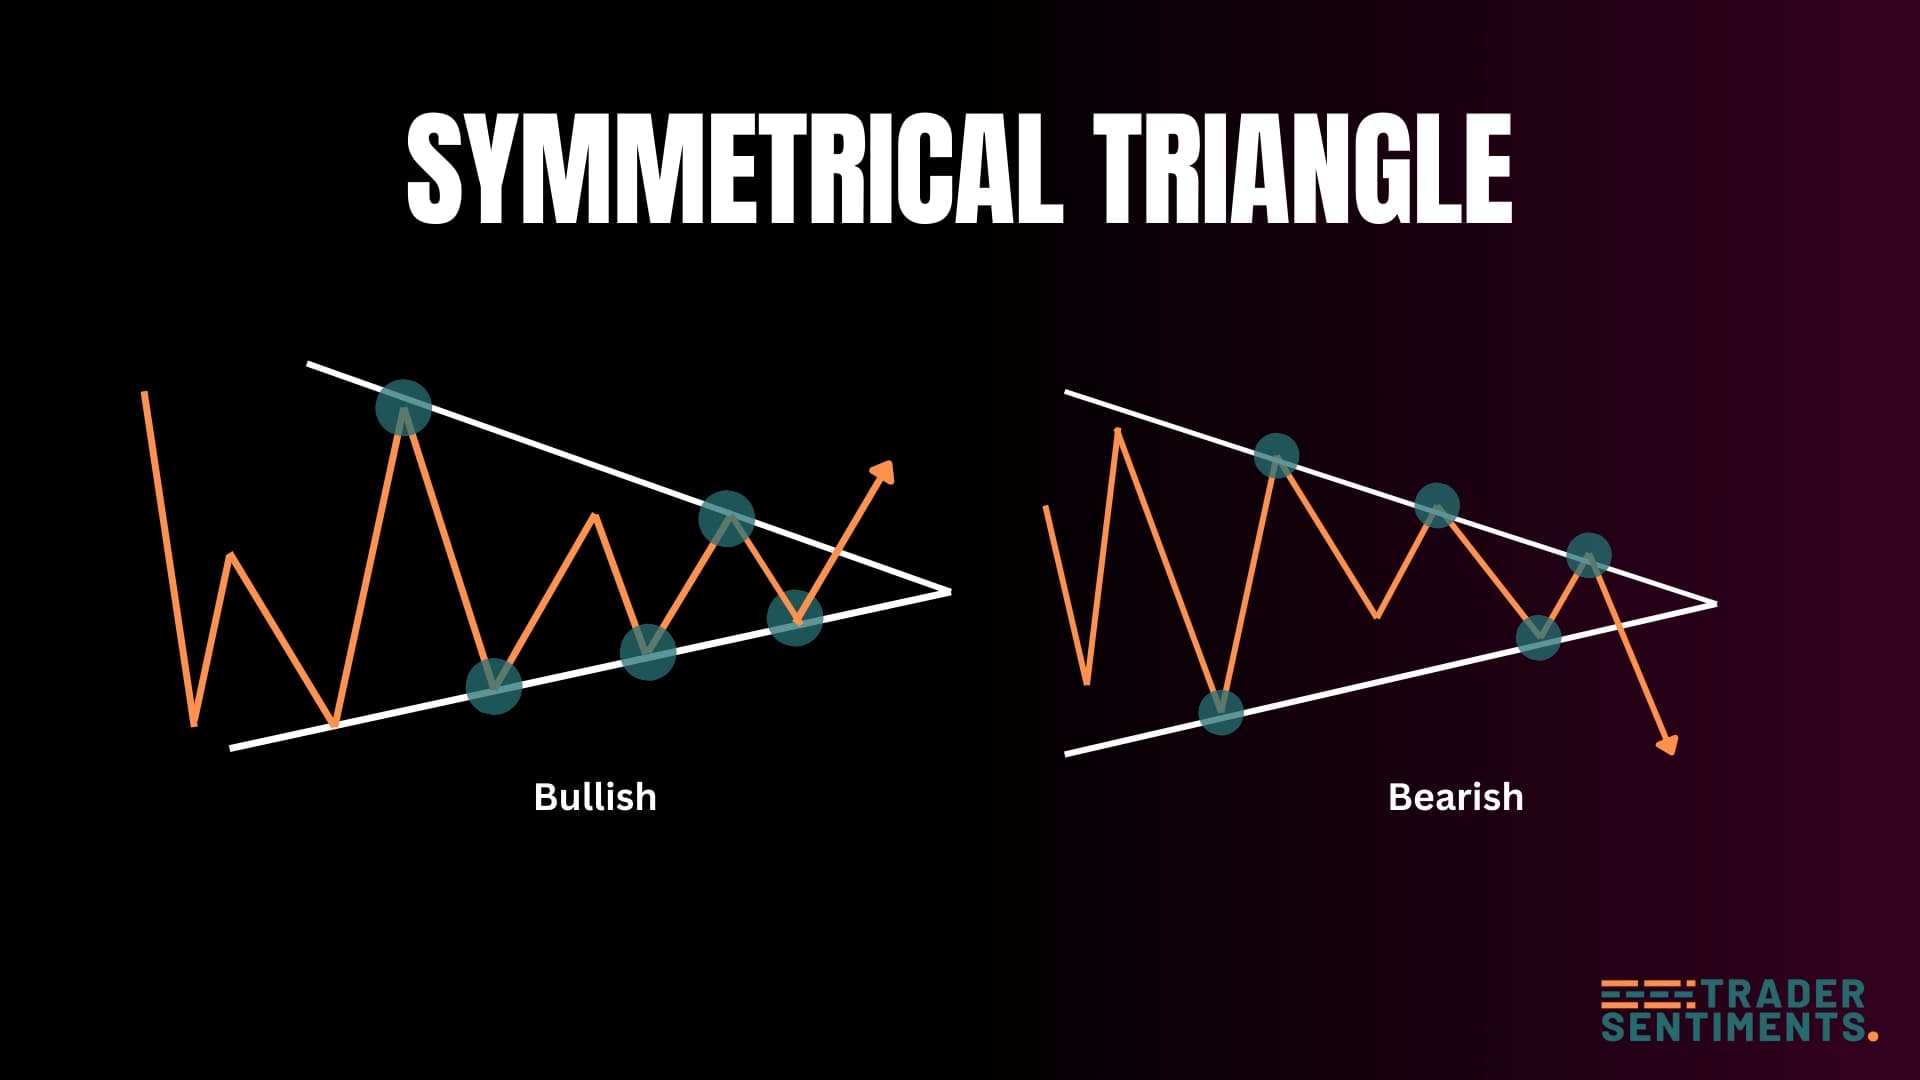
The symmetrical triangle is a neutral continuation pattern with converging trendlines. It forms when price makes lower highs and higher lows, creating a triangle shape. The pattern typically continues the prior trend after breakout.
Pattern structure
- Descending resistance: Line connecting lower highs.
- Ascending support: Line connecting higher lows.
- Convergence: Lines meet at an apex.
- Breakout: Price breaks through one of the trendlines.
- Continuation: Usually continues prior trend direction.
How to identify
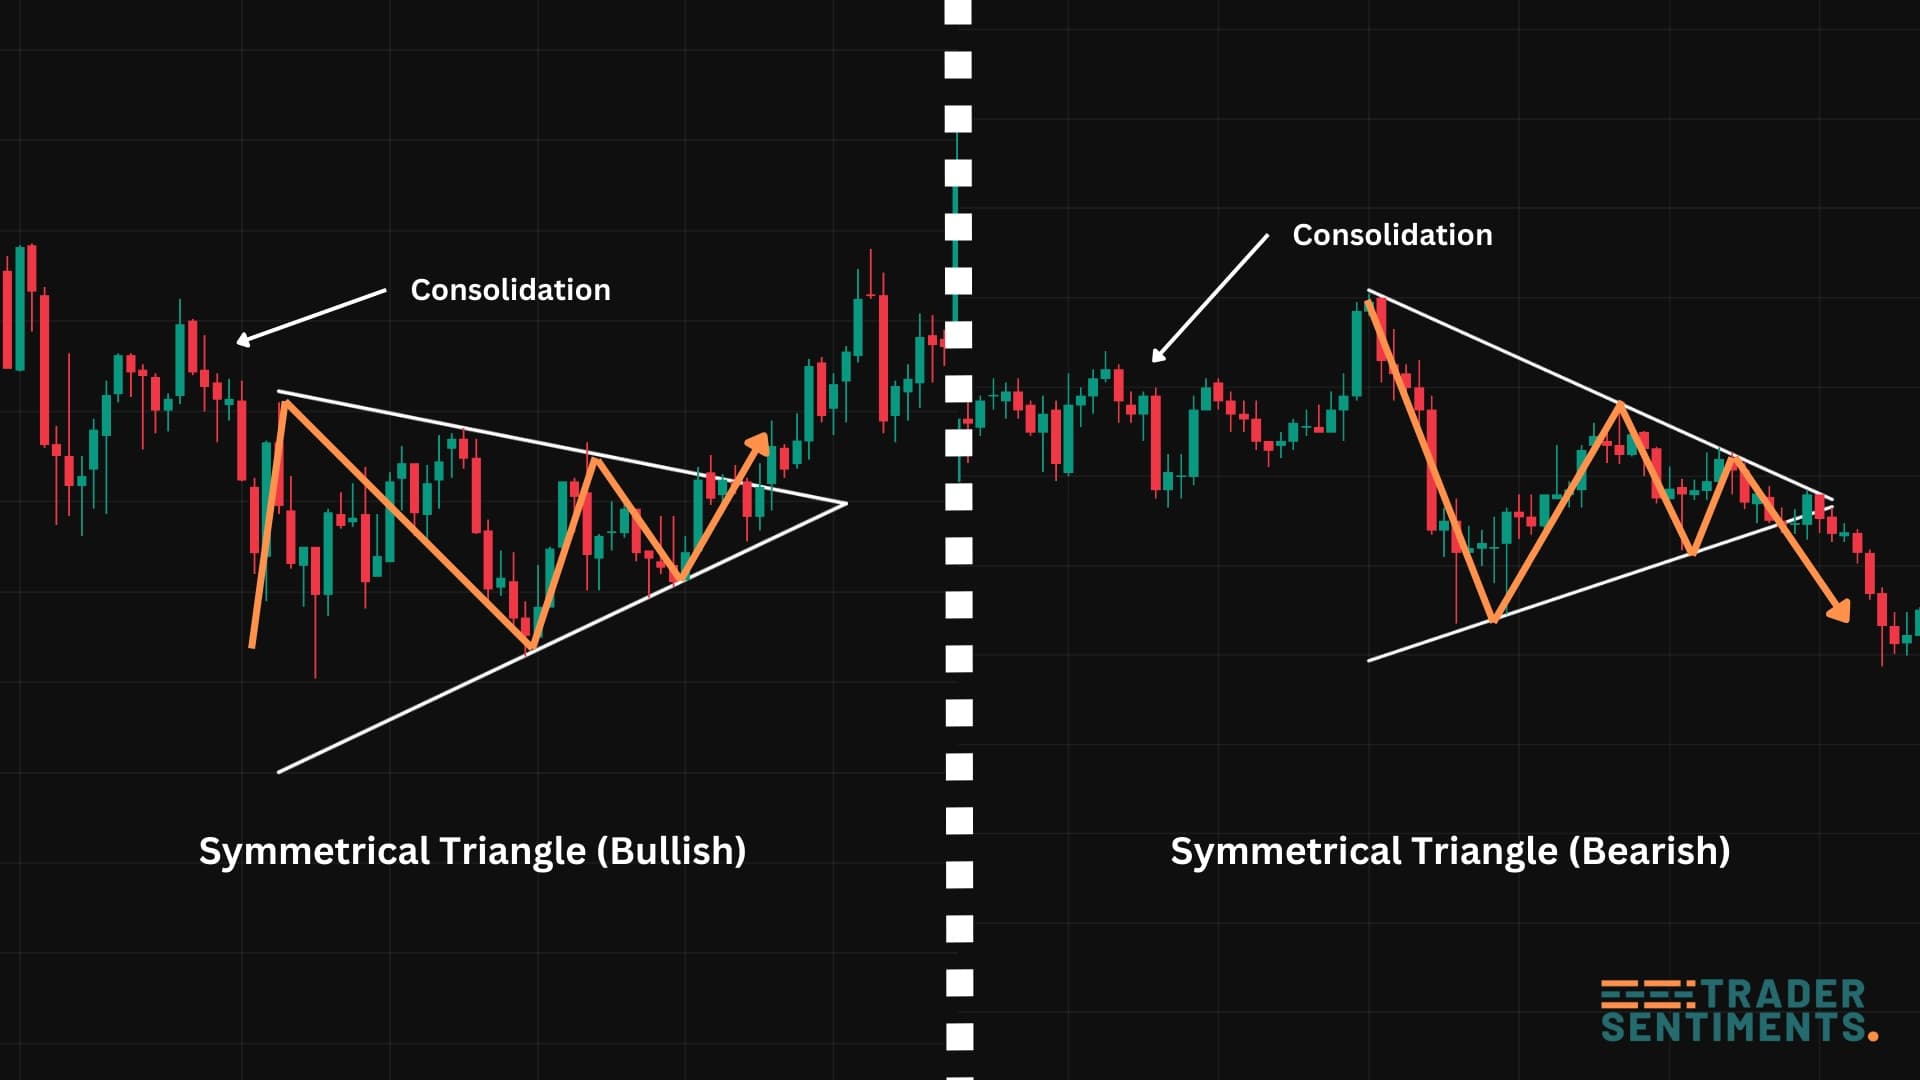
Forms during an existing trend as consolidation.
Both trendlines slope toward each other at similar angles.
Need at least 2 touches on each trendline.
Decreases during consolidation, increases on breakout.
Trading the pattern
Entry rules
- Wait for breakout: Don't trade inside the triangle.
- Confirm direction: Wait for candle close outside triangle.
- Volume: Look for increased volume on breakout.
- Retest entry: Can enter on pullback to broken trendline.
Stop-loss placement
Place stop below the triangle's lower trendline.
Place stop above the triangle's upper trendline.
Profit targets
Measure the widest part of the triangle, project from breakout point.
- Triangle width = 200 pips
- Upward breakout at 1.1000
- Target = 1.1200
Common mistakes
Wait for clear breakout confirmation.
Don't predict breakout direction, wait for confirmation.
Always protect your position.