
The bullish rectangle is a continuation pattern that forms when price pauses between two parallel horizontal levels, a flat resistance and flat support, after an initial upward trend. It represents a consolidation phase where buyers and sellers reach temporary equilibrium before the uptrend resumes. The longer the rectangle holds, the more powerful the eventual breakout tends to be. This guide covers the structure, psychology, entry techniques, and risk management for trading the bullish rectangle effectively.
What is a bullish rectangle?
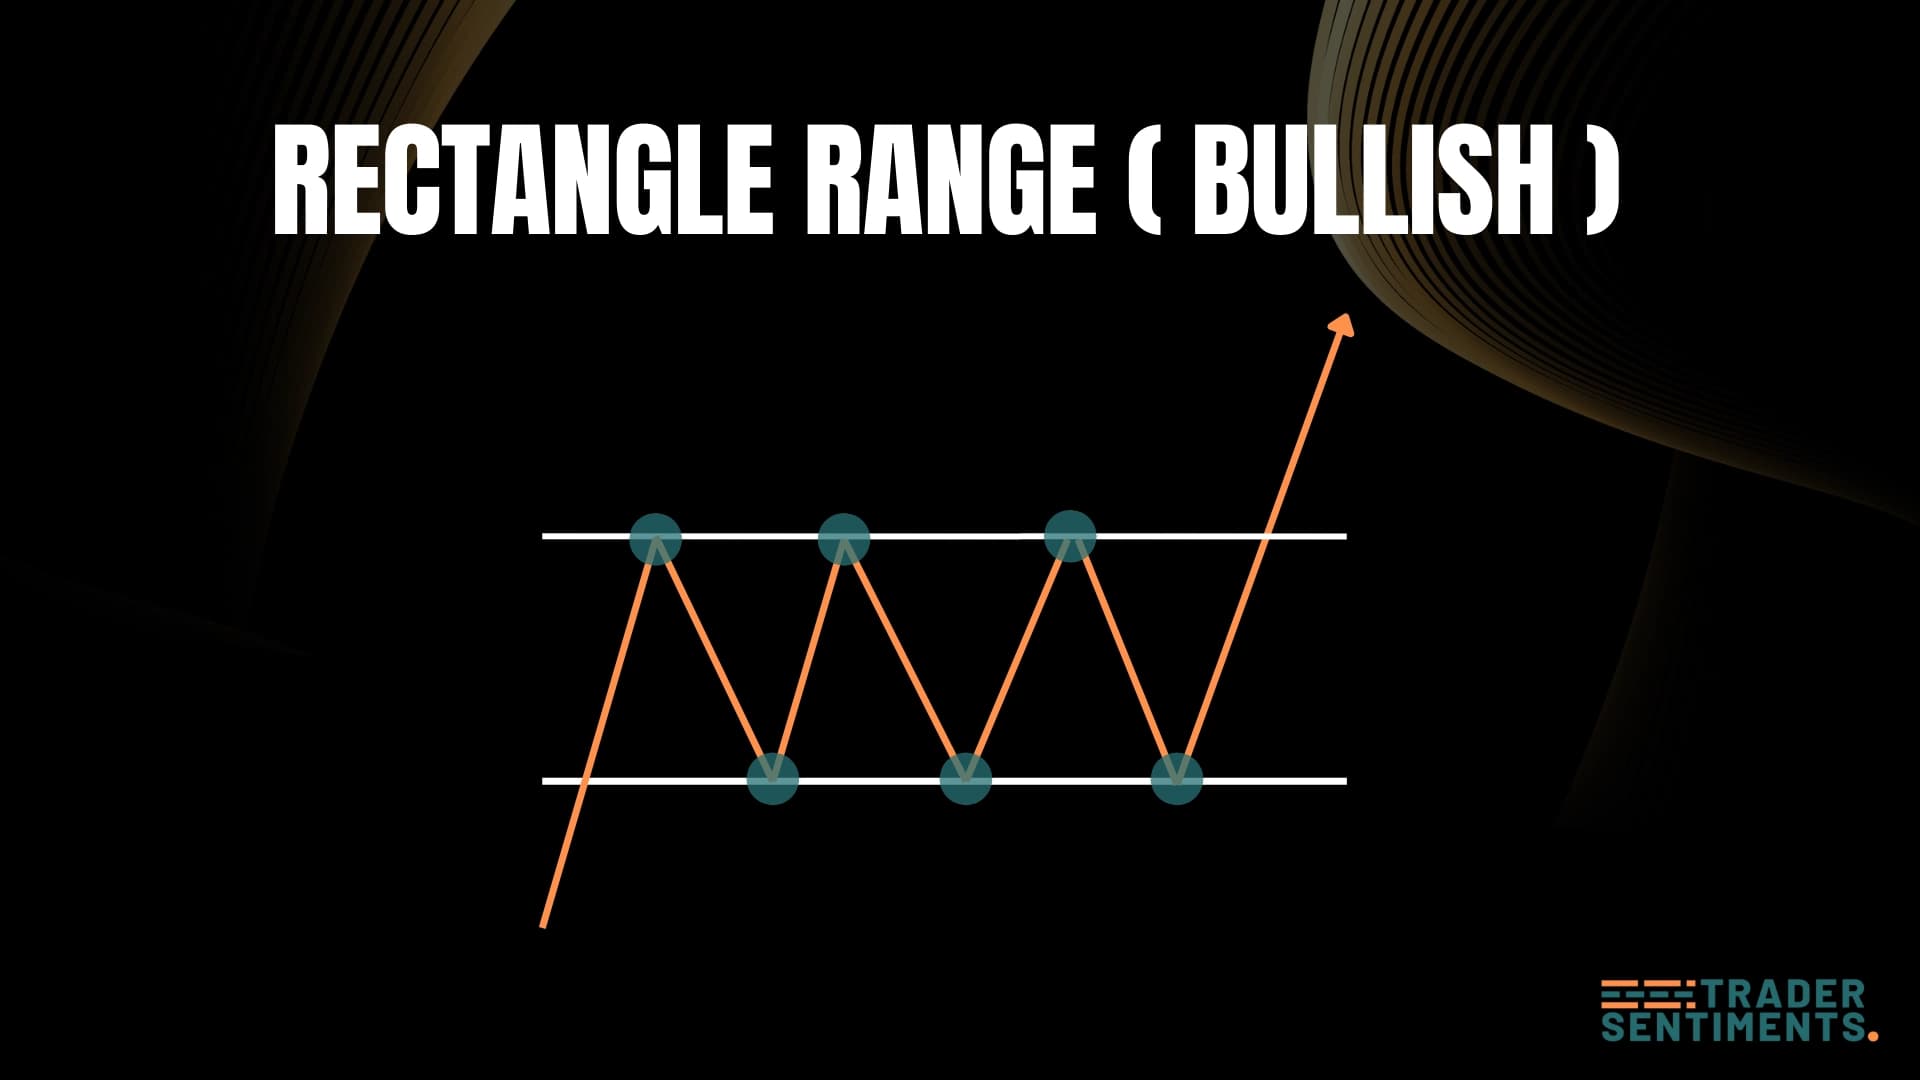
The bullish rectangle is a continuation pattern that appears during an uptrend. It represents a period of consolidation where buyers and sellers are in equilibrium, bounded by parallel horizontal support and resistance lines, before the buyers eventually take control again.
Pattern structure
- Trend: Prior strong uptrend.
- Range: Price bounces between horizontal support and resistance.
- Volume: Typically declines during the range.
- Breakout: Price closes above the resistance line.
How to identify
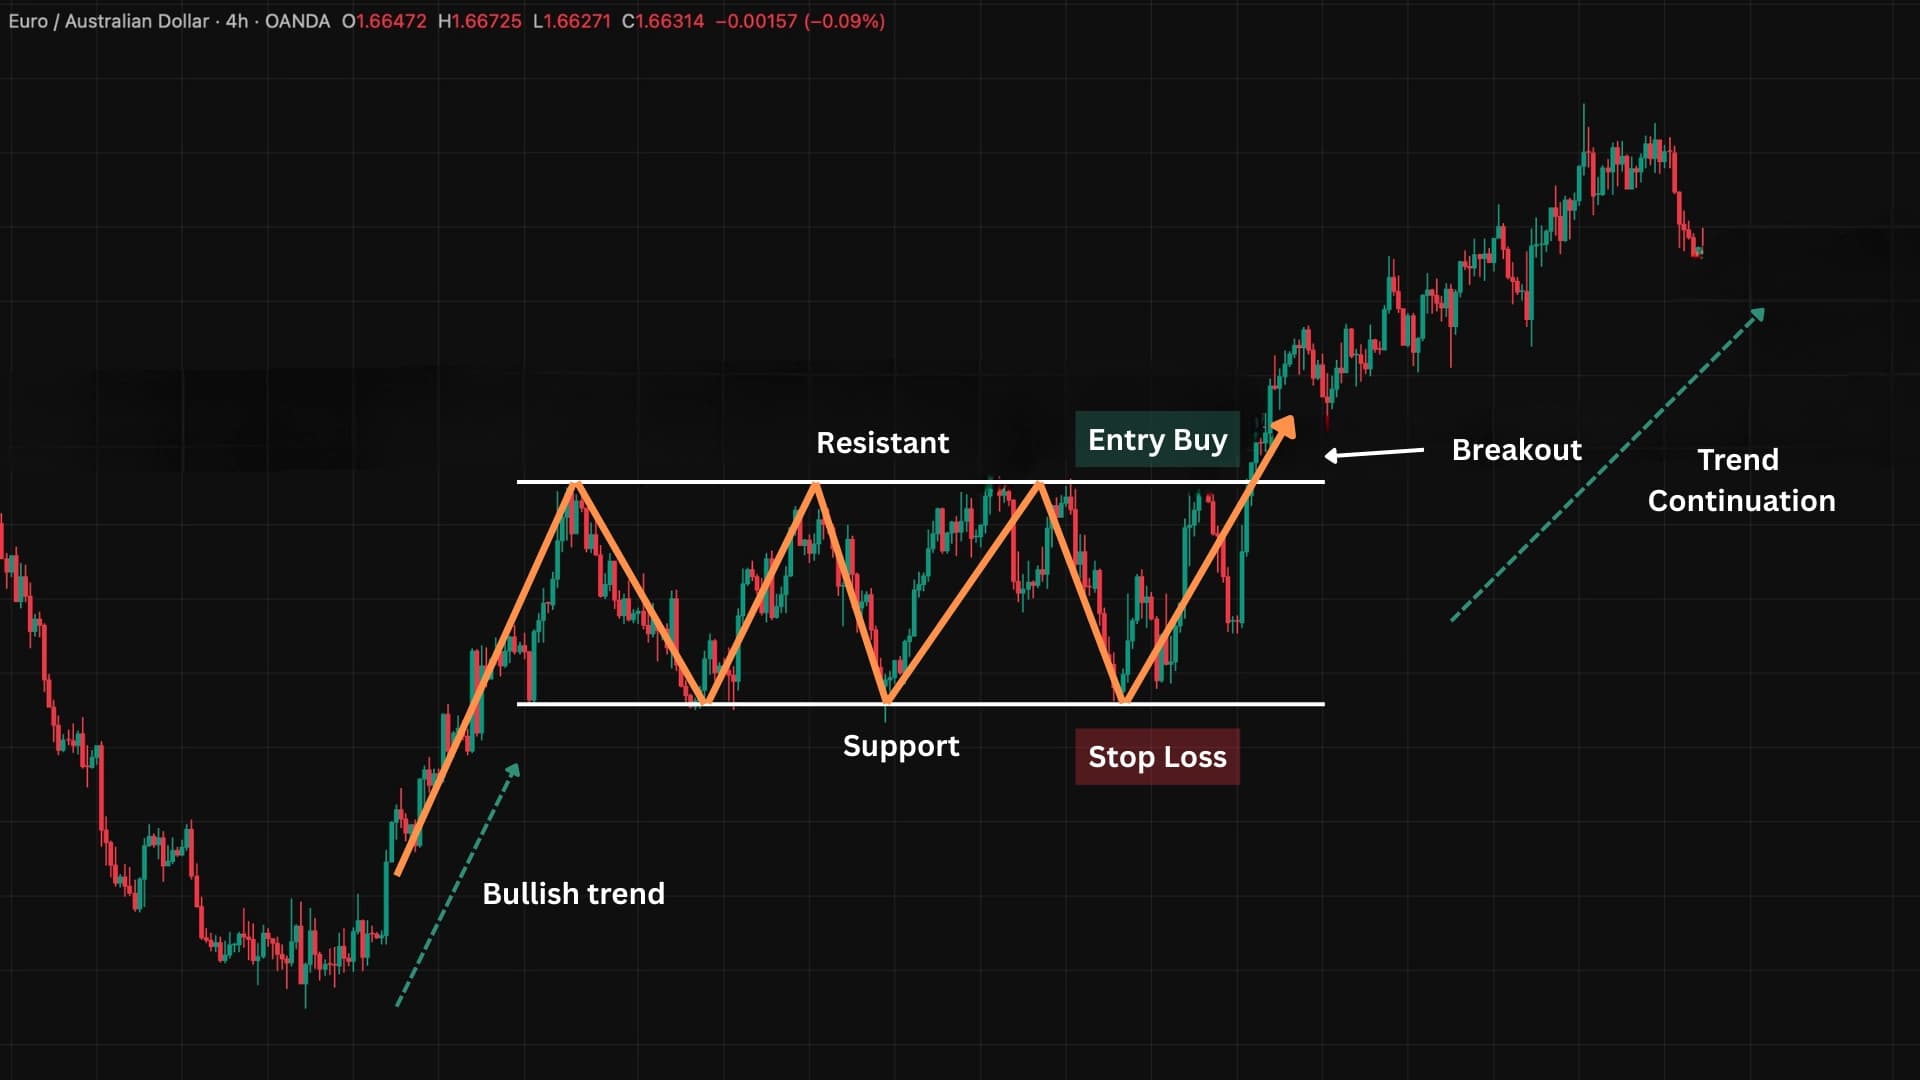
Support and resistance should be horizontal and parallel.
At least two touches on both support and resistance.
Trading the pattern
Entry rules
- Standard: Buy when a candle closes above resistance.
- Retest: Buy when price pulls back to the broken resistance line.
Stop-loss placement
Below the middle of the range.
Just below the resistance line (after breakout).
Profit targets
Measure the height of the rectangle range. Add this height to the breakout price.
Common mistakes
Buying at support is range trading, not trend continuation.