
The bearish rectangle is a continuation pattern that forms when price pauses between two parallel horizontal levels, a flat resistance and flat support, after an initial downward trend. It represents a consolidation phase where buyers and sellers reach temporary equilibrium before the downtrend resumes. The eventual breakdown from a bearish rectangle is often swift and powerful, particularly after prolonged consolidation. This guide covers the structure, psychology, entry techniques, and risk management for trading the bearish rectangle.
What is a bearish rectangle?
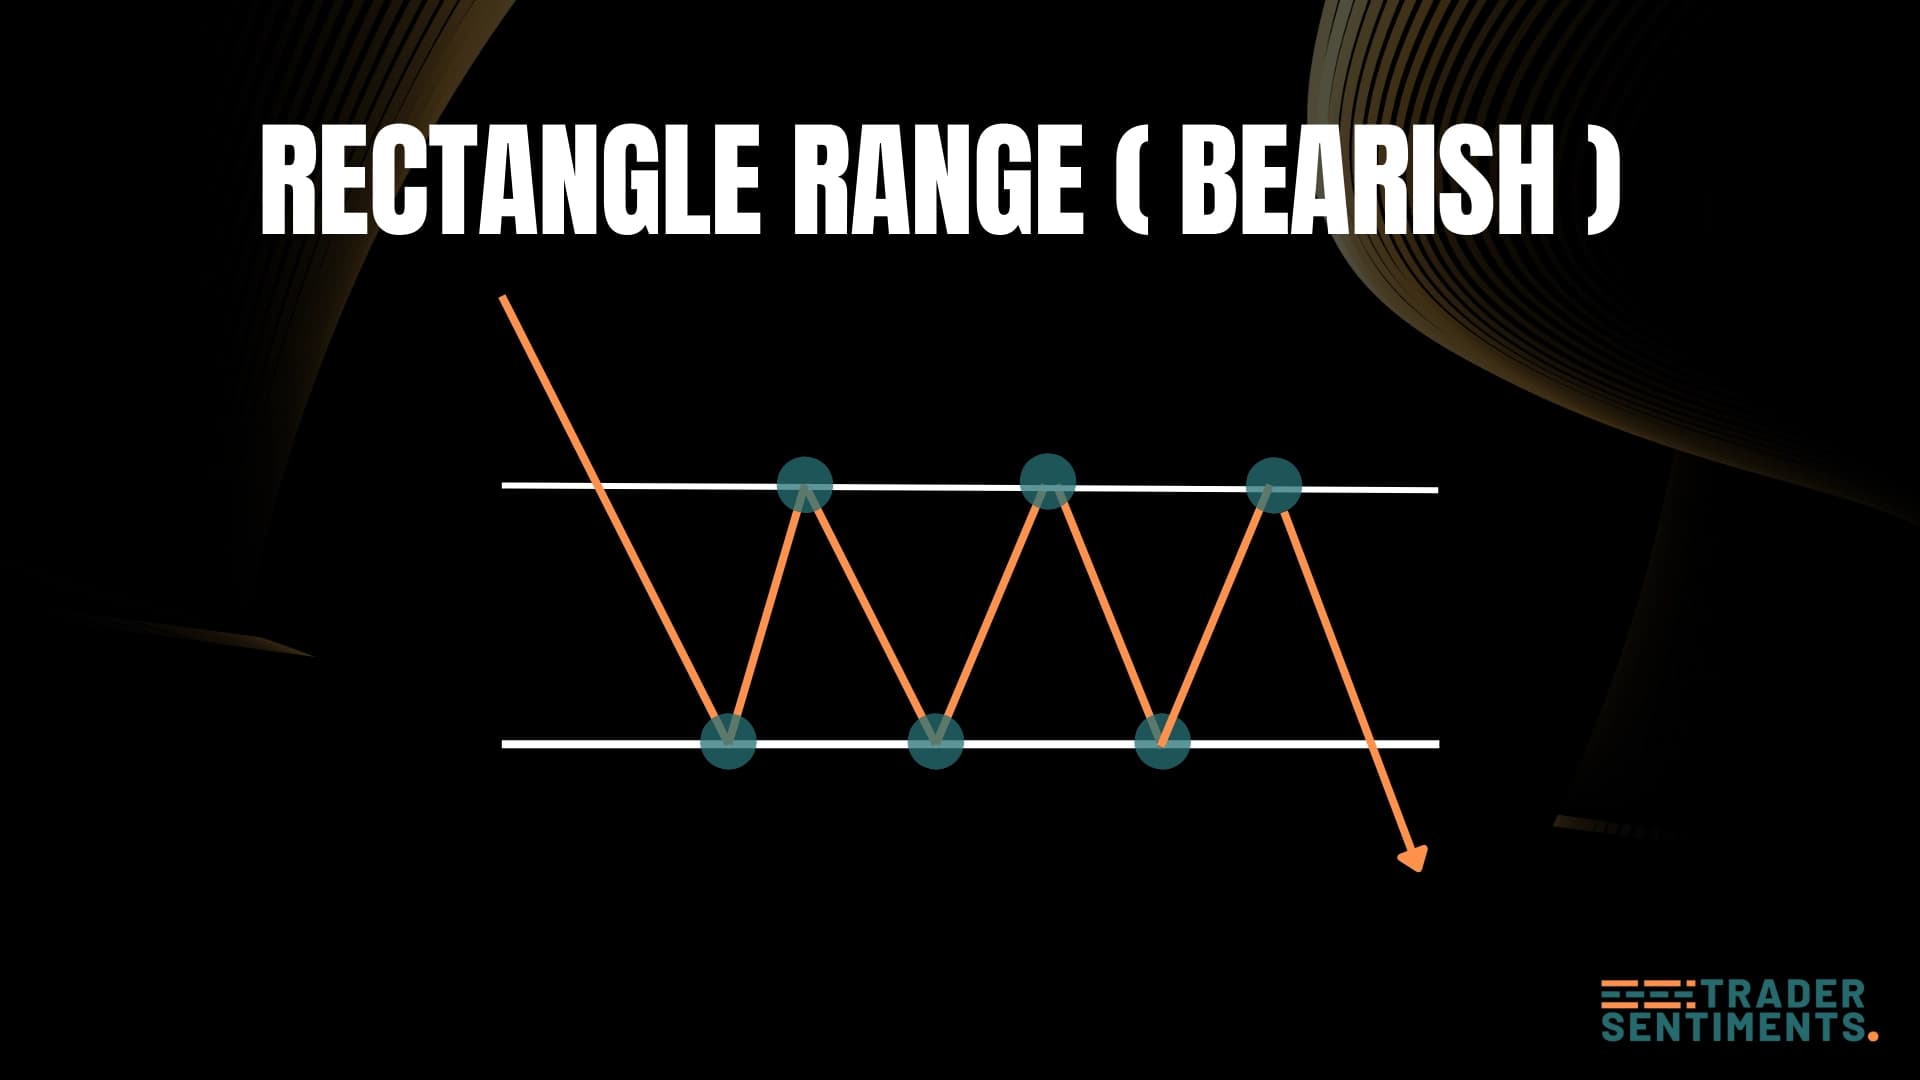
The bearish rectangle is a continuation pattern that appears during a downtrend. It represents a period of consolidation where price moves sideways between parallel lines before sellers push it lower.
Pattern structure
- Trend: Prior strong downtrend.
- Range: Sideways movement between support and resistance.
- Volume: Typically declines.
- Breakout: Price closes below the support line.
How to identify
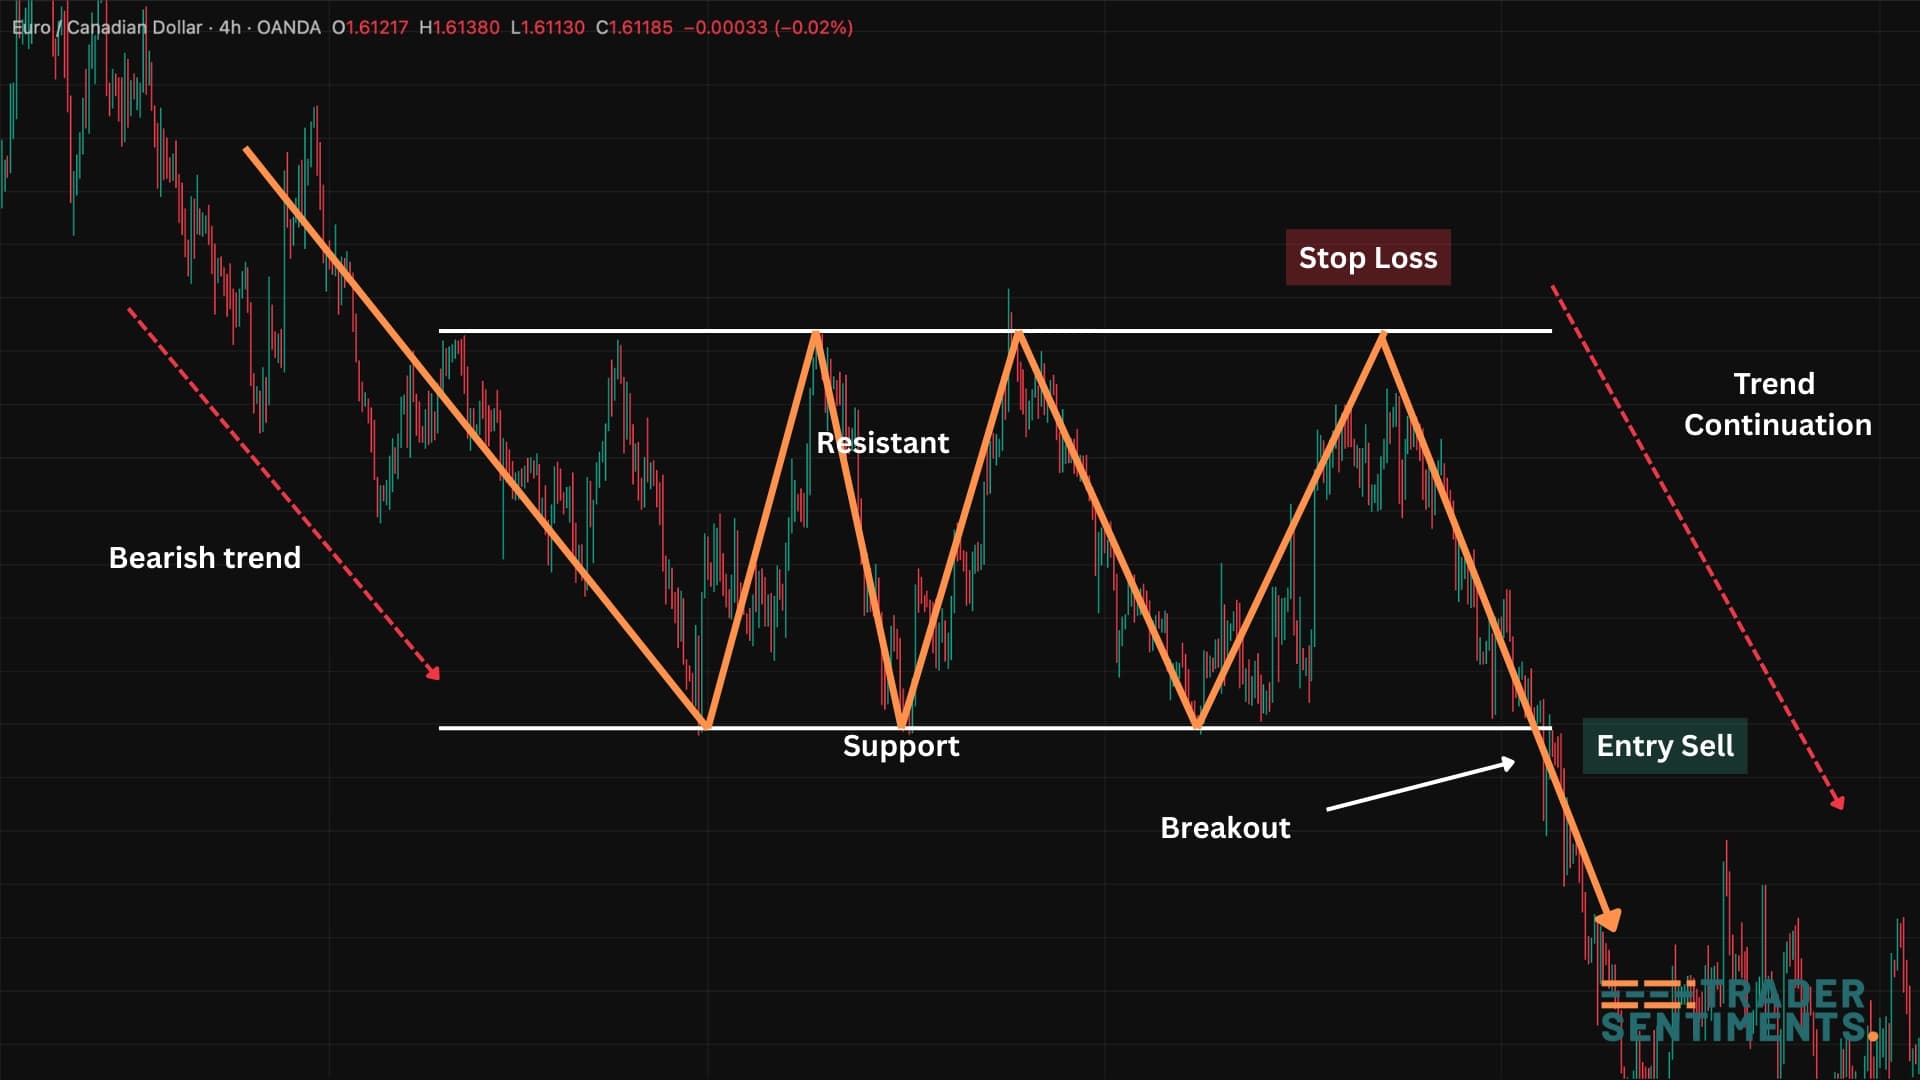
Support and resistance should be clear and parallel.
Must occur after a price drop.
Trading the pattern
Entry rules
- Standard: Sell (short) when a candle closes below support.
- Retest: Sell when price rallies back to the broken support line.
Stop-loss placement
Above the middle or top of the range.
Just above the support line (after breakout).
Profit targets
Measure the rectangle height. Subtract this from the breakdown price.
Common mistakes
This is range trading. For trend continuation, wait for the breakdown.