
The inverse head and shoulders is one of the most powerful and widely traded bullish reversal patterns in technical analysis. It forms after a downtrend and consists of three troughs: a left shoulder, a deeper central trough called the head, and a right shoulder at approximately the same level as the left. The pattern reflects a progressive shift in control from sellers to buyers. When price breaks above the neckline, it often signals the start of a sustained and significant uptrend. This guide covers the complete structure, psychology, entry techniques, confirmation signals, and risk management for trading the inverse head and shoulders.
What is an inverse head and shoulders pattern?
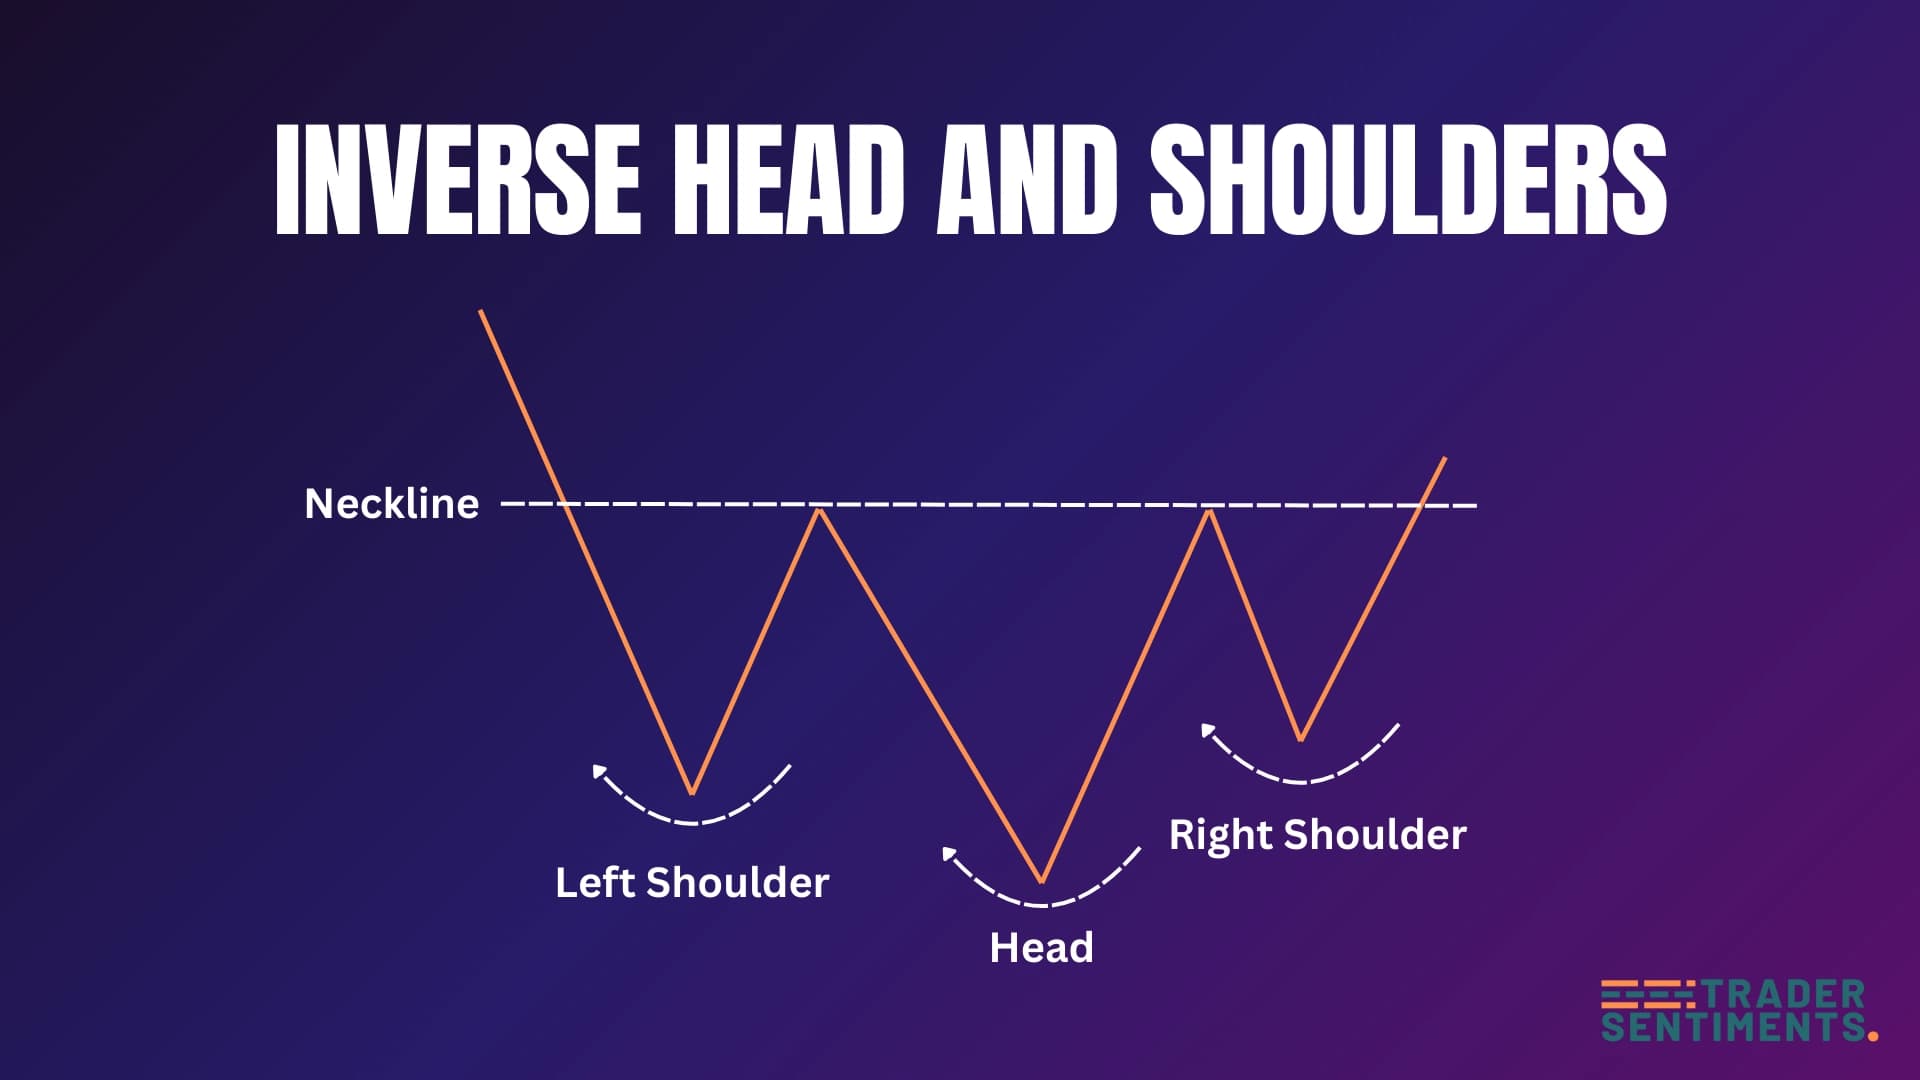
The inverse head and shoulders pattern is a bullish reversal formation that signals the end of a downtrend. It forms when price creates three troughs: a left shoulder, a lower central trough (the head), and a right shoulder at approximately the same height as the left shoulder. The pattern is complete when price breaks above the neckline.
Pattern structure
- Left shoulder: Price declines to a trough and rallies back.
- Head: Price declines lower than the left shoulder, then rallies again.
- Right shoulder: Price declines but fails to reach the head's depth, forming a higher trough similar to the left shoulder.
- Neckline: A resistance line drawn connecting the peaks between the shoulders and head.
- Breakout: Pattern confirms when price breaks above the neckline with volume.
How to identify the pattern
The pattern must form after a sustained downtrend. It signals trend exhaustion and reversal.
Left shoulder and right shoulder should be roughly equal in depth, with the head clearly lower.
The neckline can be horizontal, sloping up, or sloping down. It acts as resistance until broken.
Volume typically decreases as the pattern forms and increases on the neckline break.
Trading the pattern
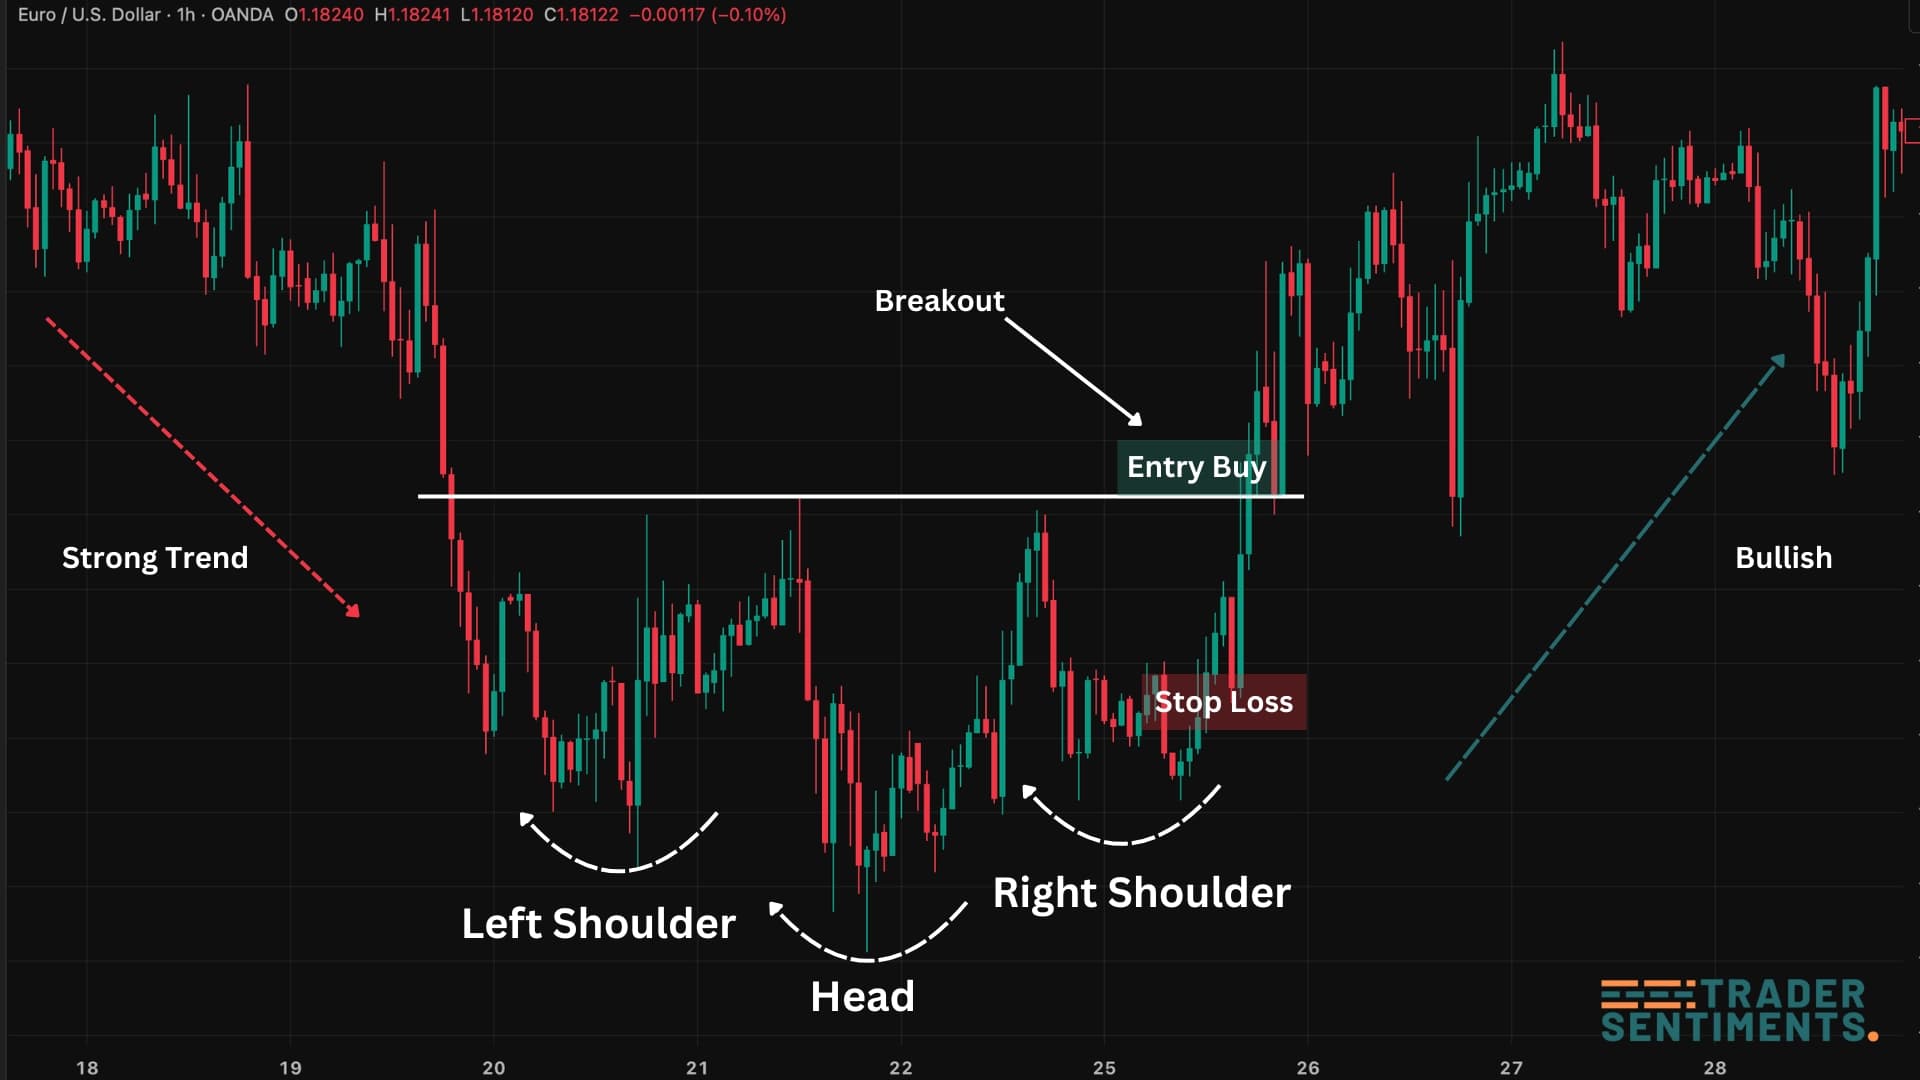
Entry rules
- Conservative entry: Wait for a candle close above the neckline.
- Aggressive entry: Enter on the neckline retest after the break.
- Volume confirmation: Look for increased volume on the neckline break.
- Timeframe: Higher timeframes (H4, D1) provide more reliable signals.
Stop-loss placement
Place stop-loss below the head. This gives the pattern more room.
Place stop-loss below the right shoulder. Tighter stop but higher risk.
Profit targets
Measure the vertical distance from the head to the neckline, then project that distance upward from the neckline breakoutpoint.
- Measure distance from head to neckline = 200 pips
- Neckline breaks at 1.1000
- Minimum target = 1.1000 + 200 pips = 1.1200
Common mistakes to avoid
Wait for confirmation. Many patterns fail before the neckline breaks.
Low volume on the break suggests weak conviction and higher failure risk.
Patterns on M5/M15 have lower reliability. Stick to H4 and above.
Always use a stop-loss. Patterns can fail.