
The falling wedge is a powerful bullish reversal pattern, and sometimes a continuation during downtrends, defined by two downward-sloping, converging trendlines. Though price is falling within the pattern, the narrowing range and typically declining volume signal weakening bearish momentum. When price eventually breaks above the upper trendline, it often produces a sharp and sustained upward move. This guide covers the complete structure, psychology, entry techniques, and risk management for trading the falling wedge.
What is a falling wedge?
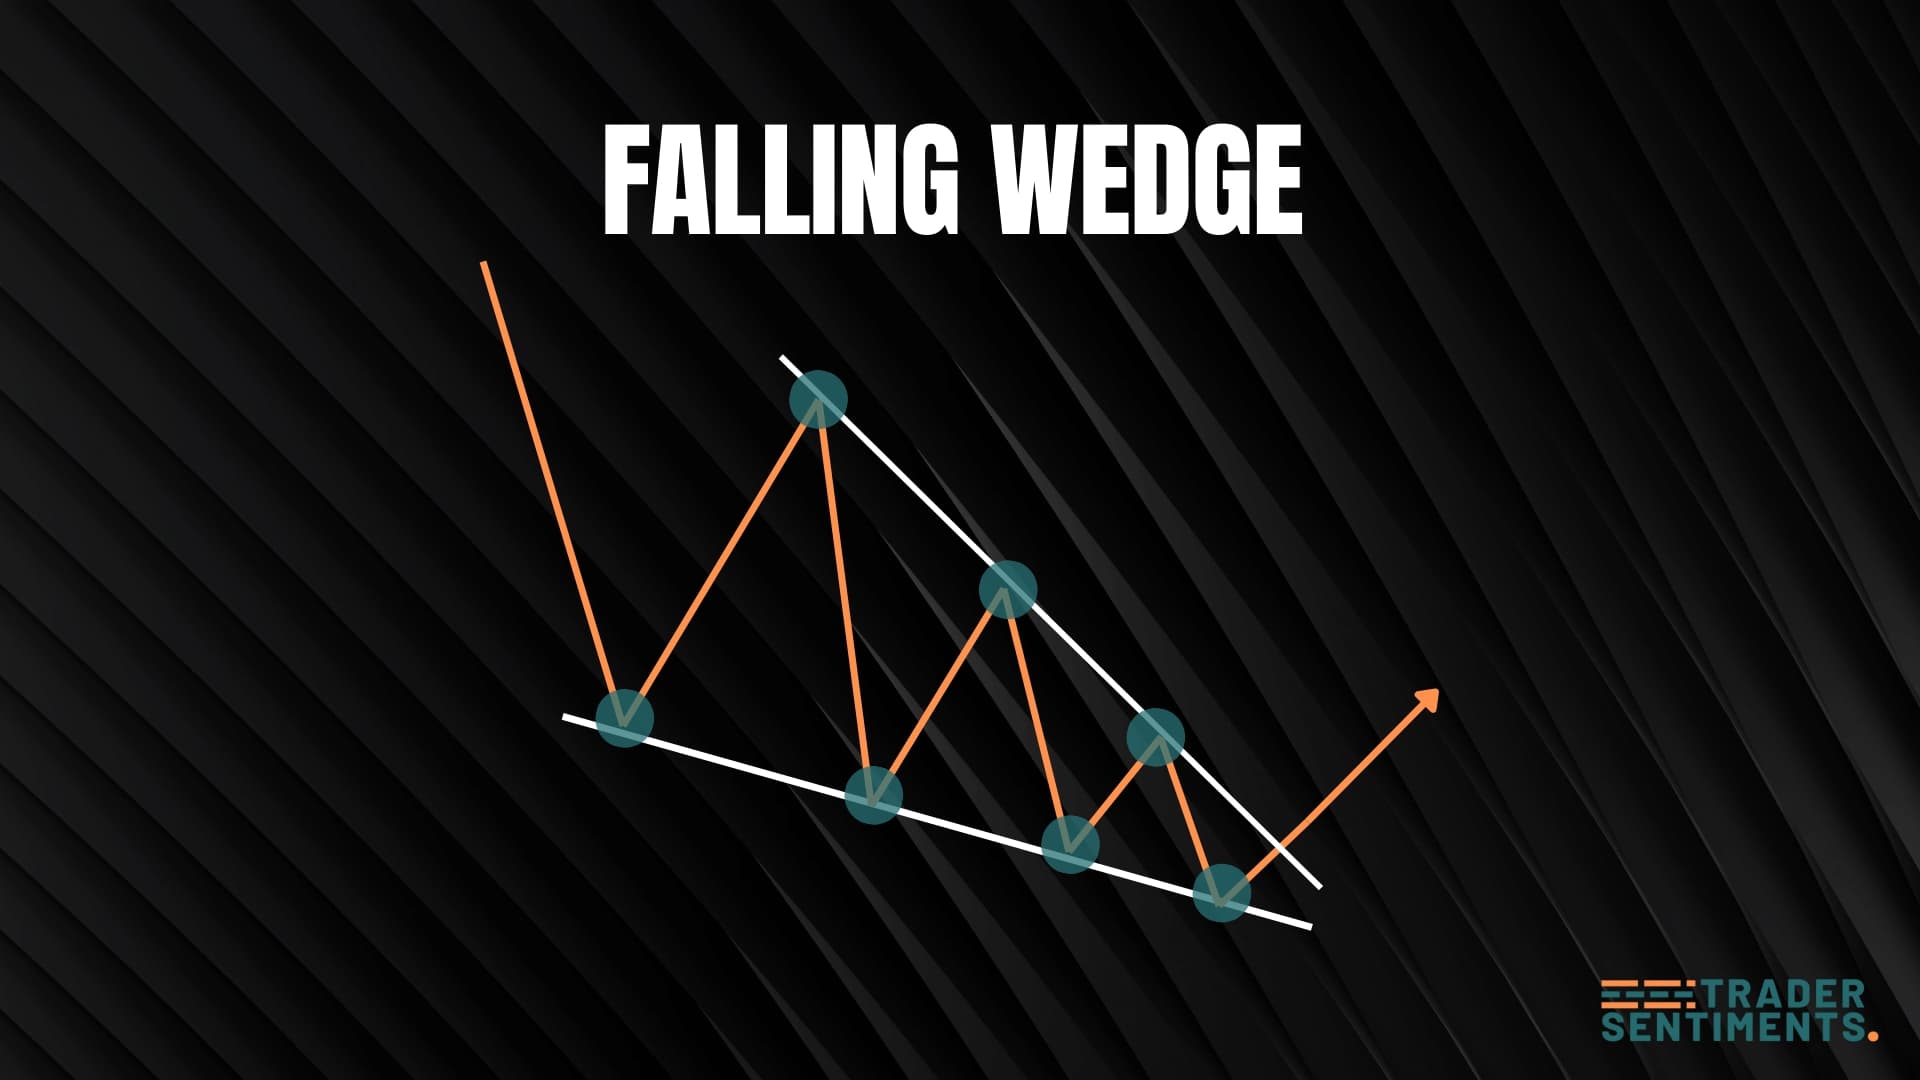
The falling wedge is a bullish pattern where price creates lower highs and lower lows, but the range contracts as trendlines slope downward. This suggests that sellers are losing momentum.
Pattern structure
- Converging lines: Both lines slope down, but resistance is steeper.
- Contraction: Price range narrows.
- Volume: Declines.
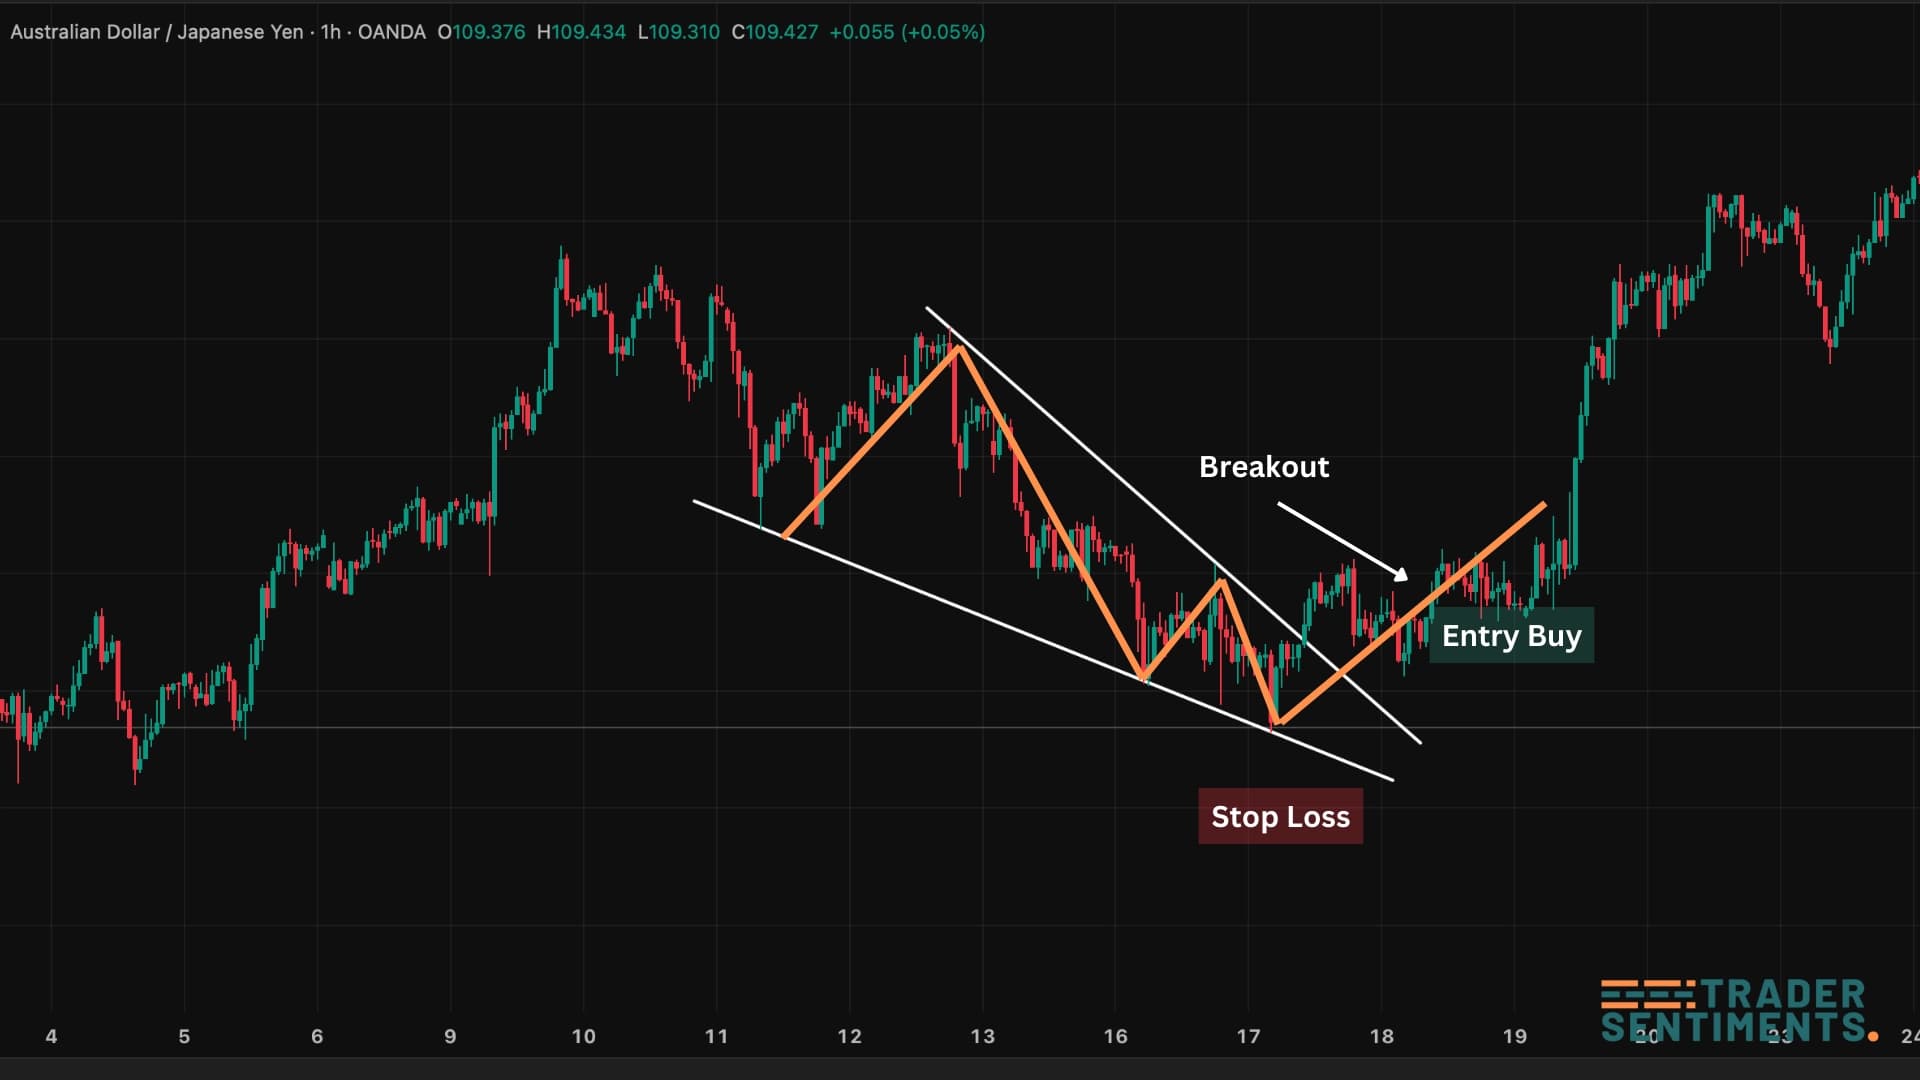
- Breakout: Price breaks above the upper trendline.
How to identify
Usually forms during a correction.
Price is falling but slowing down.
Trading the pattern
Entry rules
- Breakout: Buy when price closes above the upper trendline.
Stop-loss placement
Below the lowest point of the wedge.
Below the most recent swing low.
Profit targets
Often targets the start of the wedge formation (high point).
Common mistakes
Wait for the break of the upper trendline.