
The double bottom is one of the most widely traded bullish reversal patterns, formed by two consecutive price lows at approximately the same support level. It signals that sellers have twice tried to push price lower and failed, indicating bearish pressure is exhausting. The eventual breakout above the neckline often marks the beginning of a sustained new uptrend. This guide covers the complete structure, psychology, entry techniques, confirmation signals, and risk management for trading the double bottom effectively.
What is a double bottom pattern?
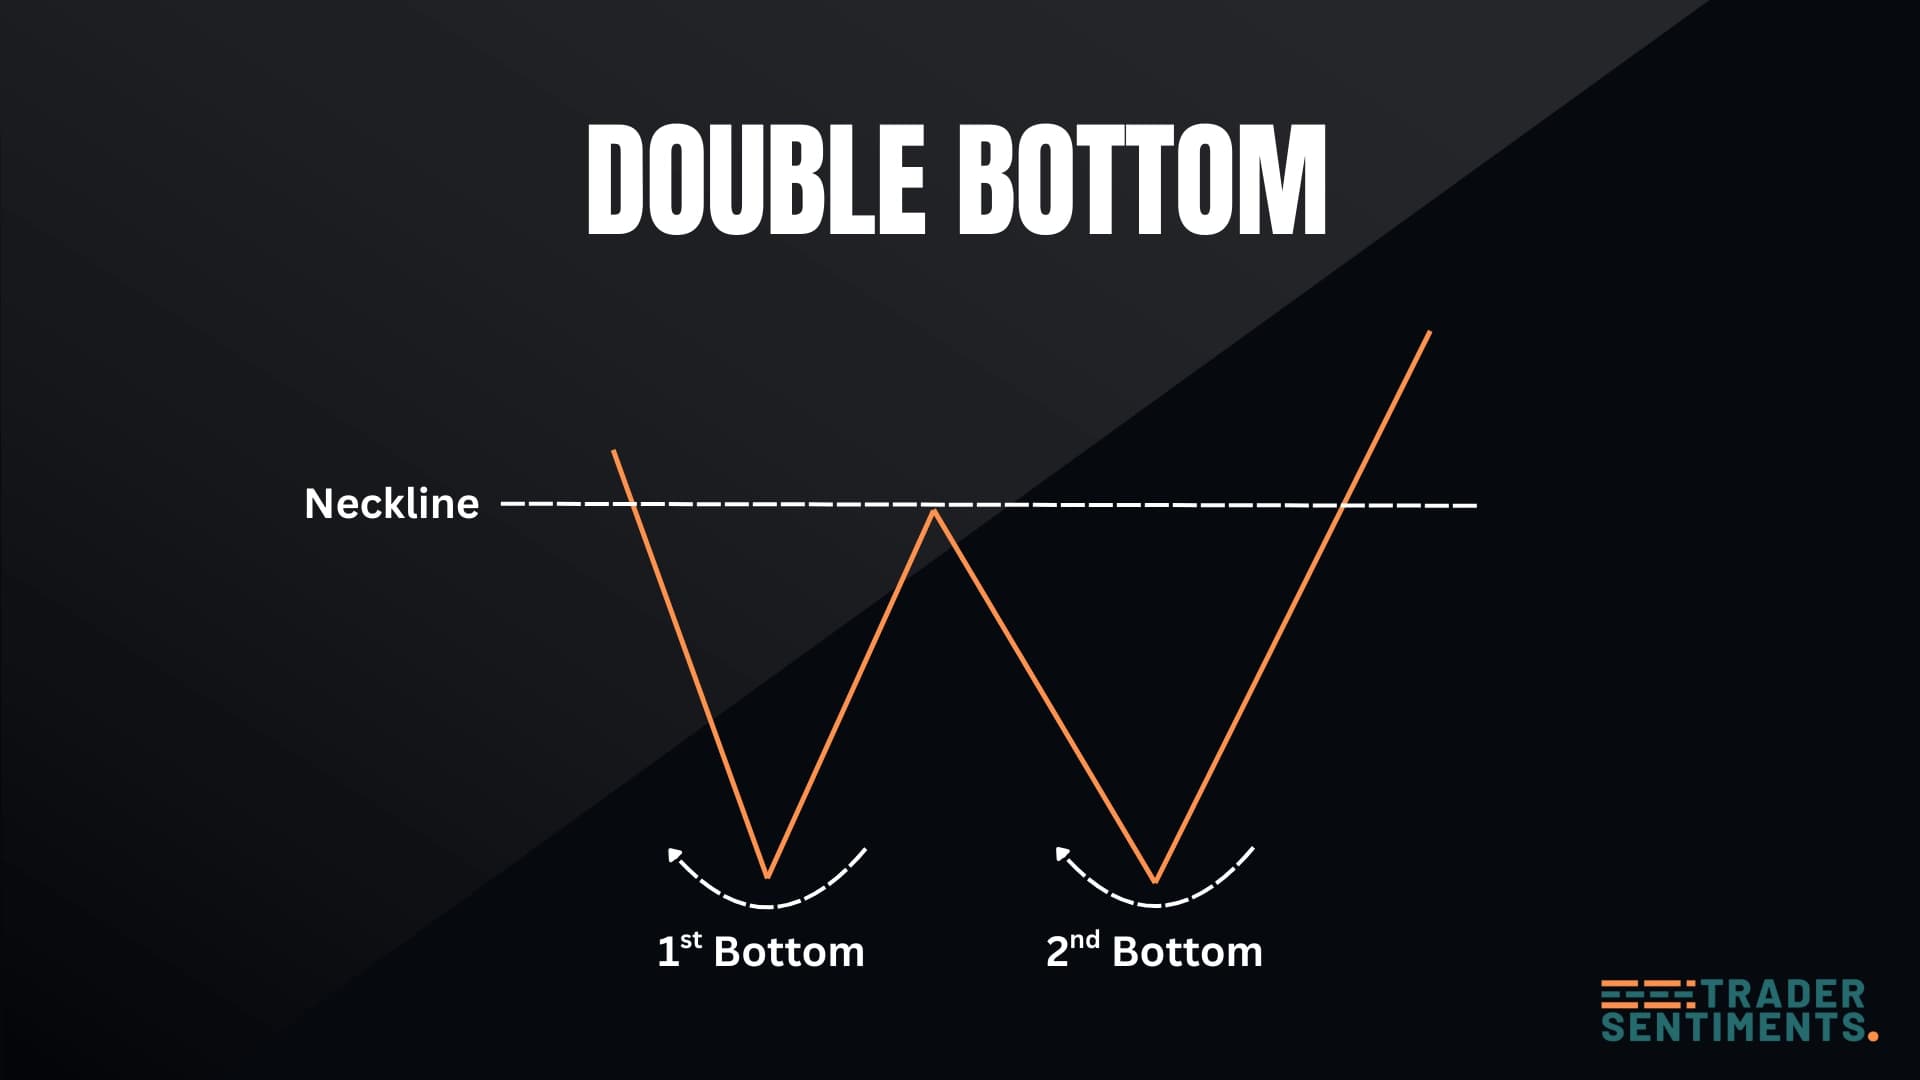
The double bottom pattern is a bullish reversal formation that signals the end of a downtrend. It forms when price reaches a support level twice, bounces, and then reverses. The pattern resembles the letter "W" and is complete when price breaks above the neckline, which connects the peaks between the two troughs.
Pattern structure
- First trough: Price declines to a support level and bounces back.
- Peak: Price rallies to a resistance level (the neckline).
- Second trough: Price declines again to approximately the same support level as the first trough, then bounces.
- Neckline: A resistance line drawn at the peak between the two troughs.
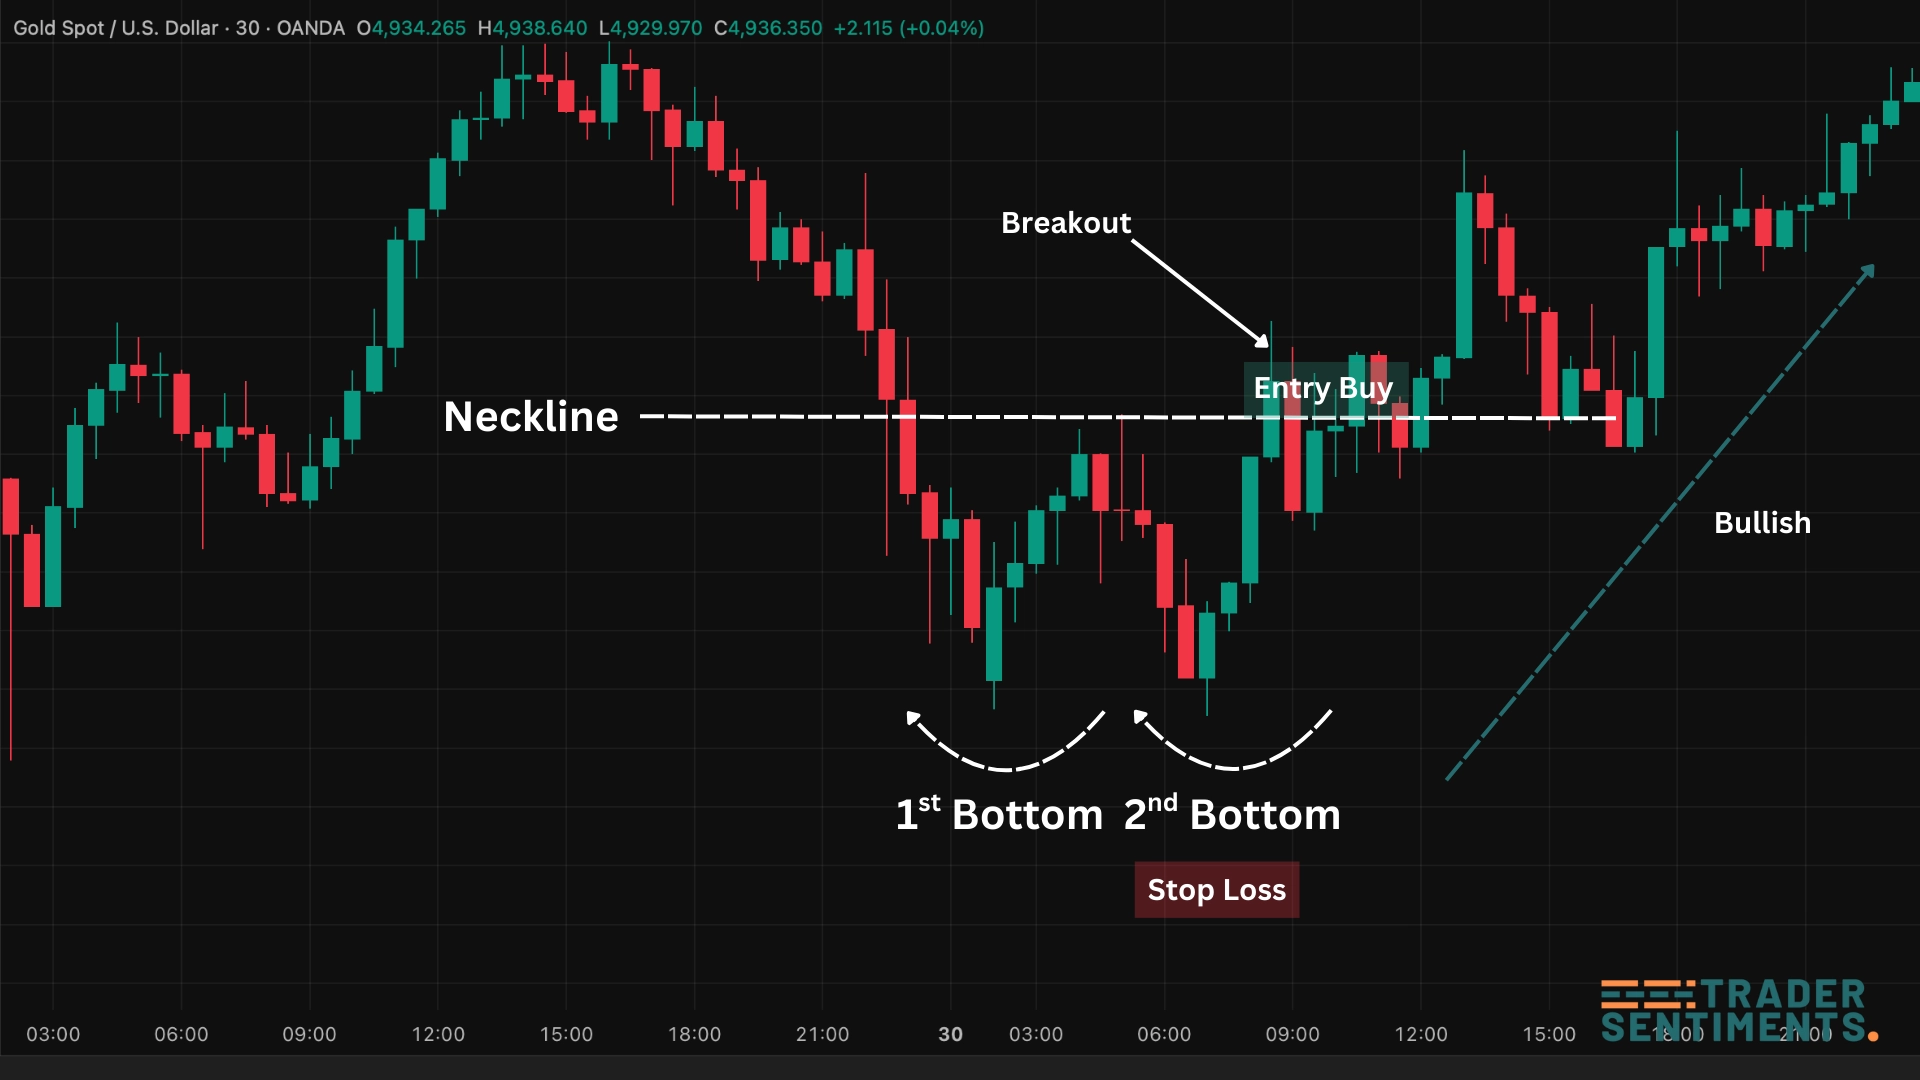
- Breakout: Pattern confirms when price breaks above the neckline with volume.
How to identify the pattern
The pattern must form after a sustained downtrend. It signals trend exhaustion and potential reversal.
The two troughs should be at approximately the same price level. Small variations are acceptable.
There should be a noticeable peak between the two troughs. The pattern is stronger when the separation is clear.
Volume typically decreases on the second trough and increases on the neckline break, confirming buying pressure.
Trading the pattern
Entry rules
- Conservative entry: Wait for a candle close above the neckline (resistance level).
- Aggressive entry: Enter on the neckline retest after the break (higher risk).
- Volume confirmation: Look for increased volume on the neckline break.
- Timeframe: Higher timeframes (H4, D1) provide more reliable signals.
Stop-loss placement
Place stop-loss below the second trough. This gives the pattern more room.
Place stop-loss slightly below both troughs. Tighter stop but higher risk of being stopped out.
Profit targets
Calculate your profit target by measuring the vertical distance from the troughs to the neckline. Project this distance upward from the neckline breakout point.
- Measure distance from troughs to neckline = 150 pips
- Neckline breaks at 1.1000
- Minimum target = 1.1000 + 150 pips = 1.1150
Common mistakes to avoid
Wait for neckline confirmation. Price can break to new lows after forming what looks like a second trough.
If the second trough is significantly higher or lower than the first, the pattern is less reliable.
Low volume on the breakout suggests weak buying pressureand higher failure risk.
Always use a stop-loss below the troughs. Patterns can fail, and risk management is essential.