
The descending triangle is a bearish continuation pattern, and sometimes a reversal, defined by a flat lower support line and a descending upper trendline. Each touch of the flat support tests buyers ability to defend the level, while lower highs show sellers growing progressively more aggressive. When support finally breaks, the result is often a swift and decisive downside move. This guide covers the complete structure, psychology, entry techniques, and risk management for trading the descending triangle.
What is a descending triangle?
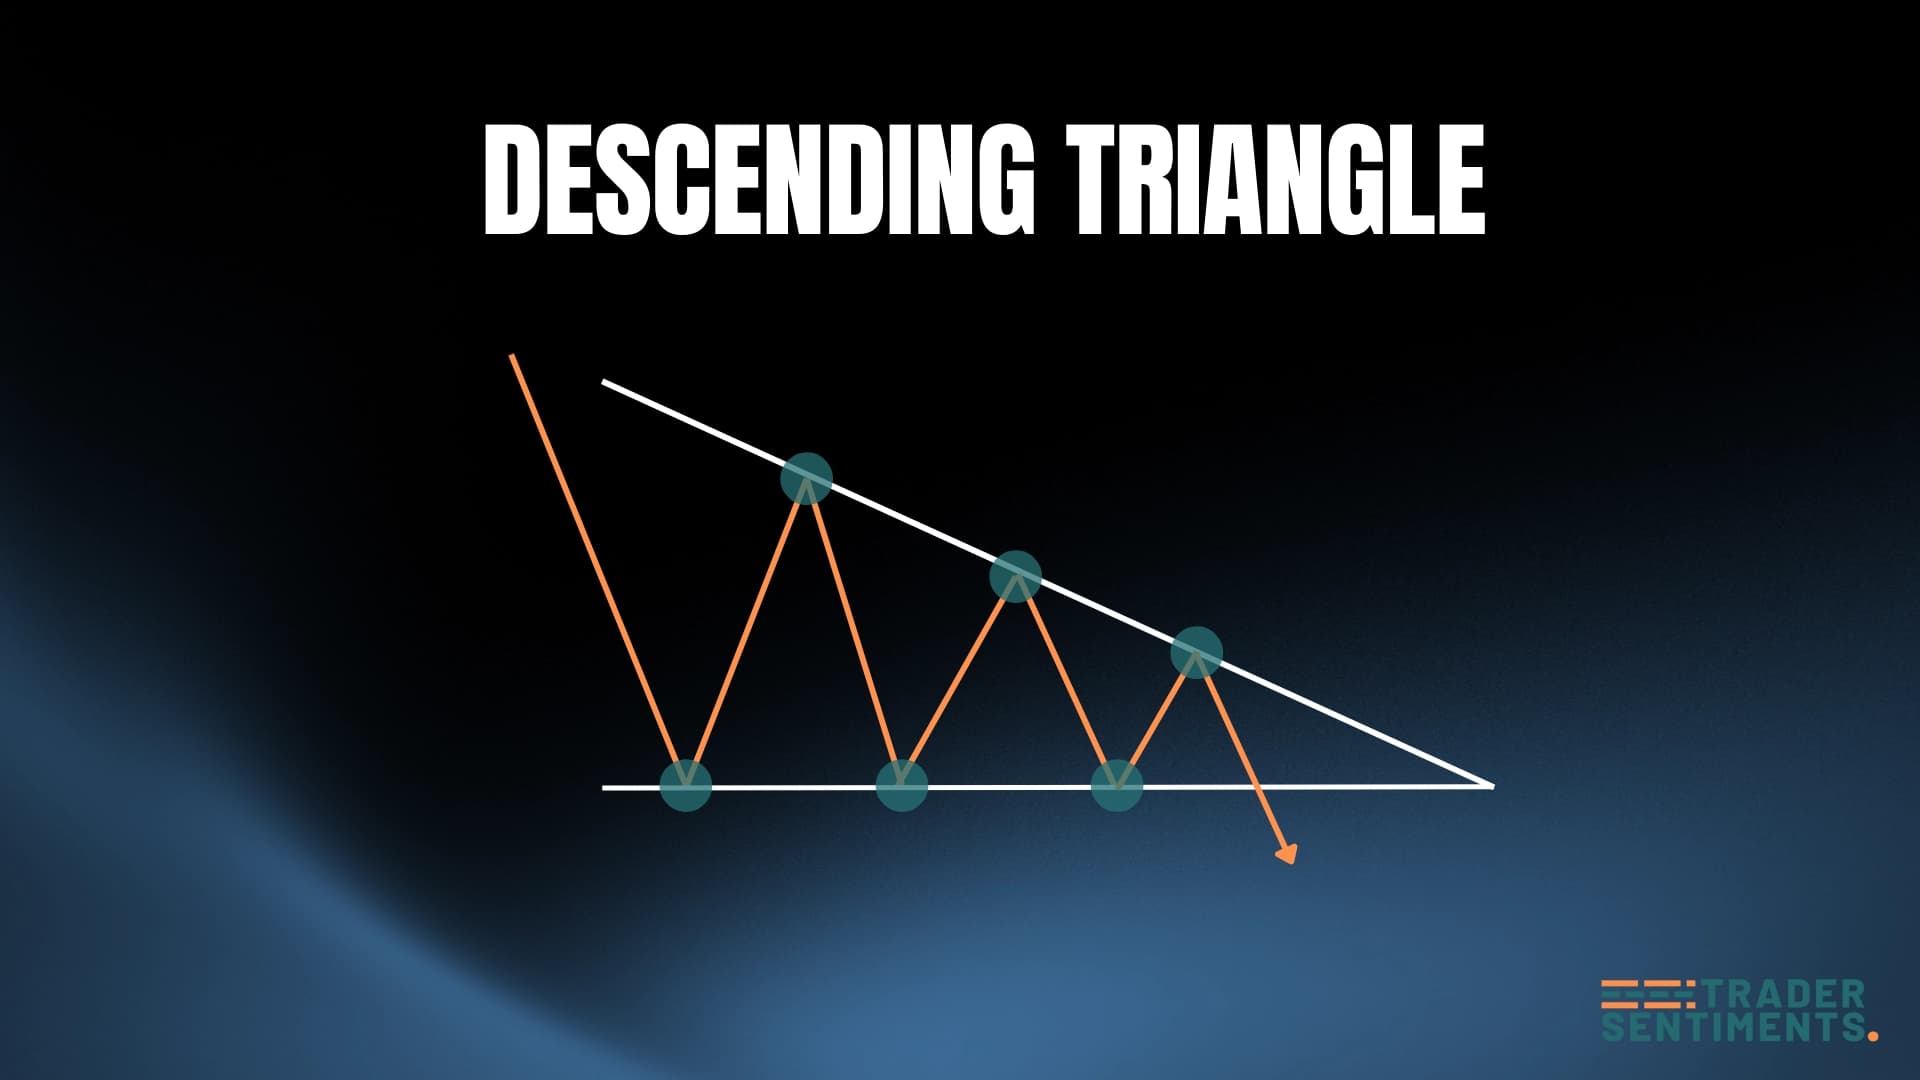
The descending triangle is a bearish continuation pattern with a flat horizontal support and descending resistance. Sellers become increasingly aggressive, pushing highs lower while support holds temporarily before breaking down.
Pattern structure
- Flat support: Horizontal line connecting at least two lows.
- Descending resistance: Downward-sloping line connecting lower highs.
- Consolidation: Price bounces between these lines.
- Breakdown: Price breaks below support with volume.
- Continuation: Downtrend resumes.
How to identify
Forms during downtrend as continuation.
Each high lower than previous, showing selling pressure.
Support holds at same level multiple times.
Decreases during consolidation, increases on breakdown.
Trading the pattern
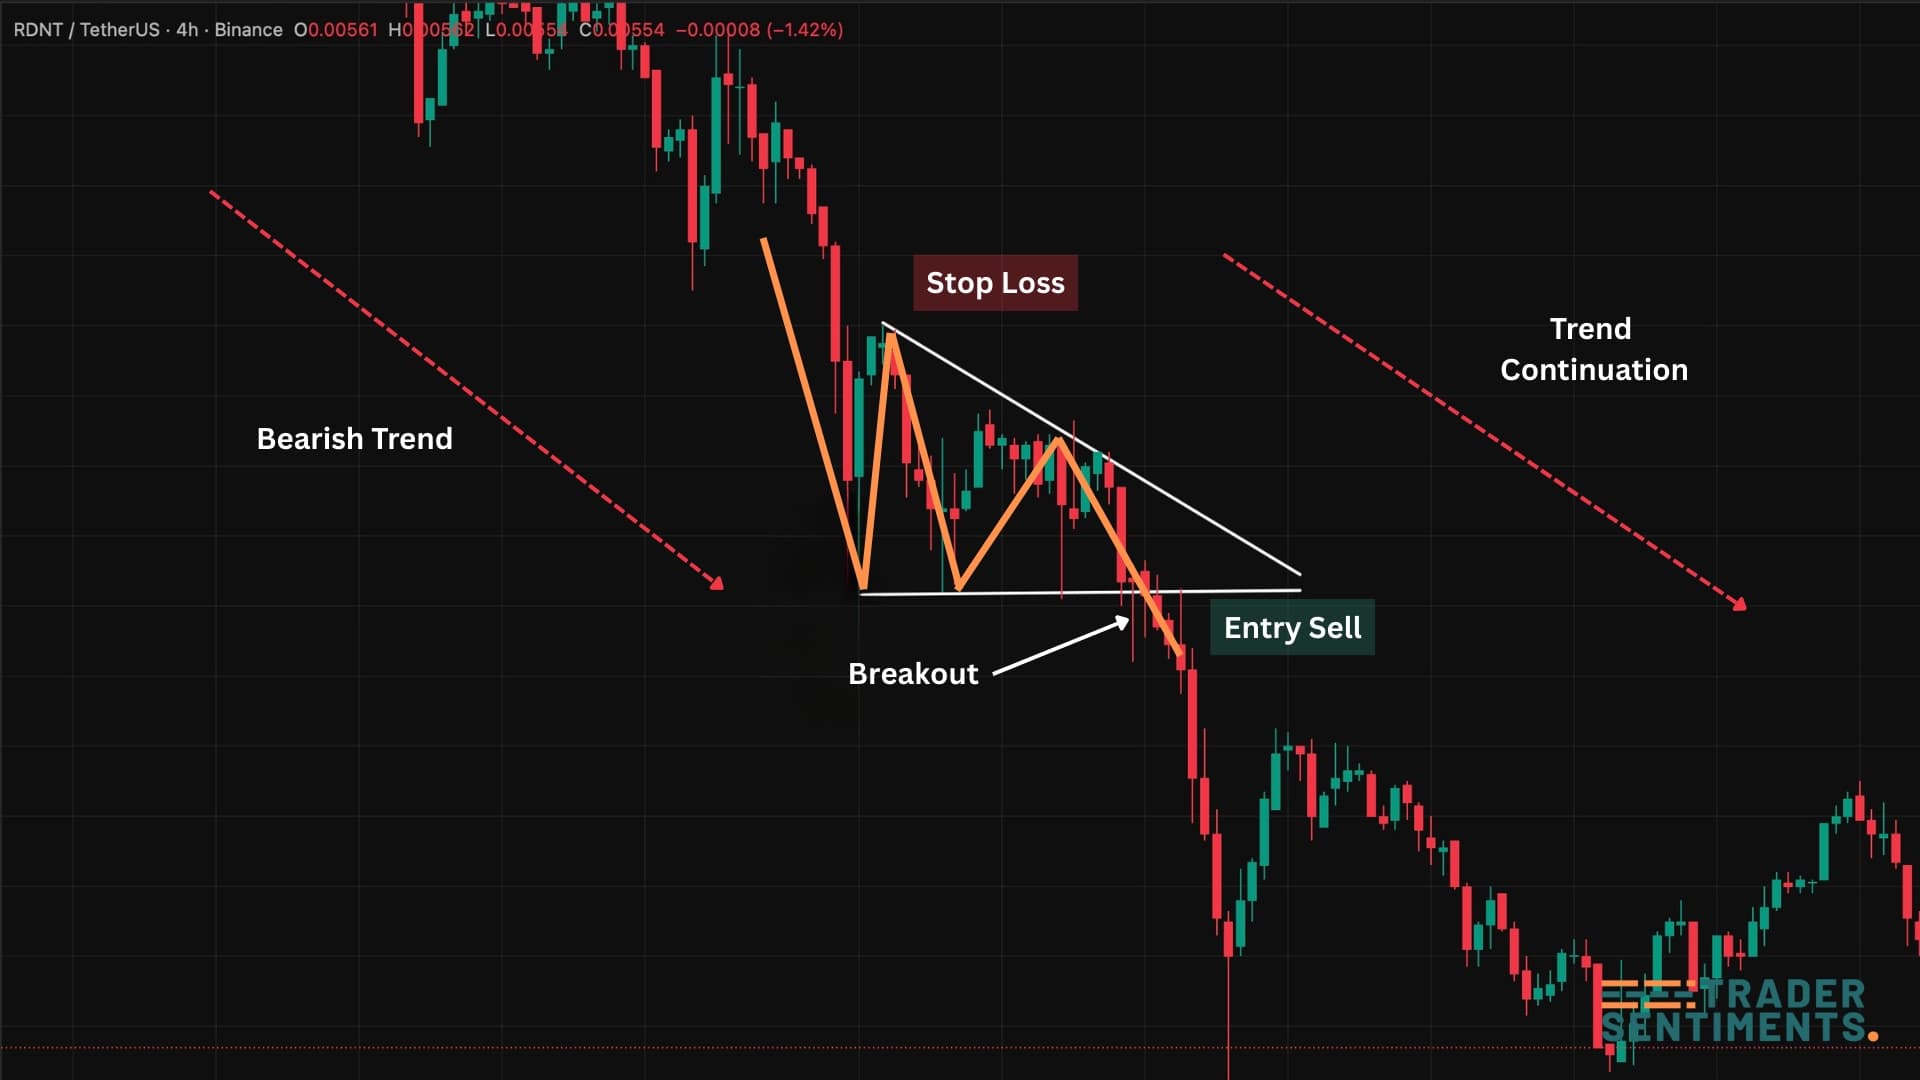
Entry rules
- Conservative: Wait for candle close below support.
- Aggressive: Enter on breakdown retest.
- Volume: Confirm with increased volume.
- Timeframe: H4/D1 most reliable.
Stop-loss placement
Above most recent lower high.
Above descending resistance line.
Profit targets
Measure height at widest point, project downward from breakdown.
- Height = 150 pips
- Breakdown at 1.1000
- Target = 1.0850
Common mistakes
Wait for confirmation.
Low volume breakdowns often fail.
Always protect capital.