
The bull flag is one of the most widely traded bullish continuation patterns in technical analysis. It forms when price makes a sharp, nearly vertical advance (the flagpole), then consolidates in a tight, slightly downward-sloping channel (the flag) before breaking higher and continuing the original upward move. The pattern is prized for its clear structure, well-defined risk, and high success rate when found in strong uptrends. This guide covers everything traders need to know about identifying, trading, and managing risk on the bull flag.
What is a bull flag pattern?
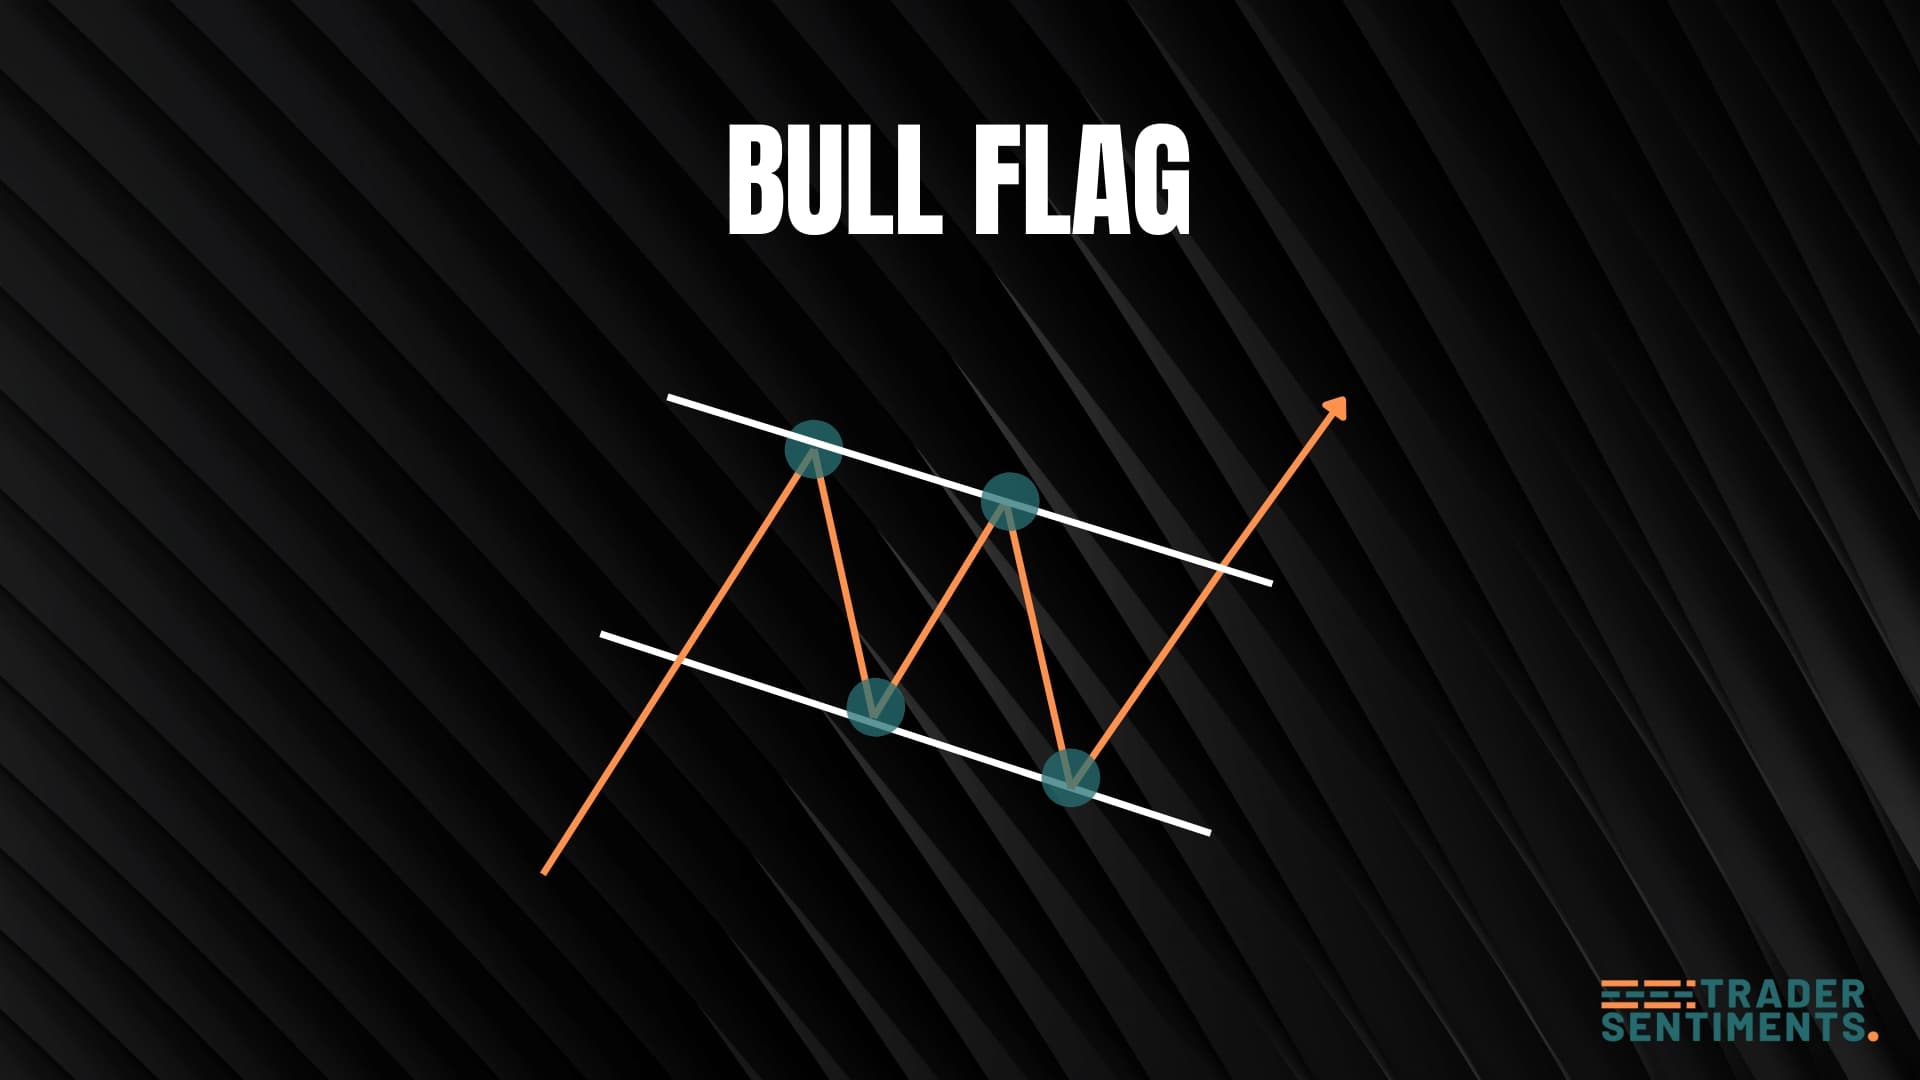
The bull flag pattern is a bullish continuation formation that occurs during an uptrend. It consists of two parts: a strong upward move (the flagpole) followed by a brief consolidation in a downward-sloping or horizontal channel (the flag). The pattern confirms when price breaks above the flag's upper trendline, signaling the uptrend will resume.
Pattern structure
- Flagpole: A strong, sharp upward move on high volume.
- Flag: A brief consolidation period with parallel or slightly downward-sloping trendlines.
- Volume: Decreases during the flag formation.
- Breakout: Price breaks above the flag's upper trendline with increased volume.
- Continuation: Price continues in the direction of the original trend.
How to identify the pattern
The pattern must form during a clear uptrend. The flagpole should be a strong, impulsive move.
The flag should be relatively short (typically 1-3 weeks on daily charts). Longer consolidations reduce reliability.
The flag should have clear parallel or slightly downward-sloping trendlines forming a channel.
Volume should be high on the flagpole, decrease during the flag, and increase on the breakout.
Trading the pattern
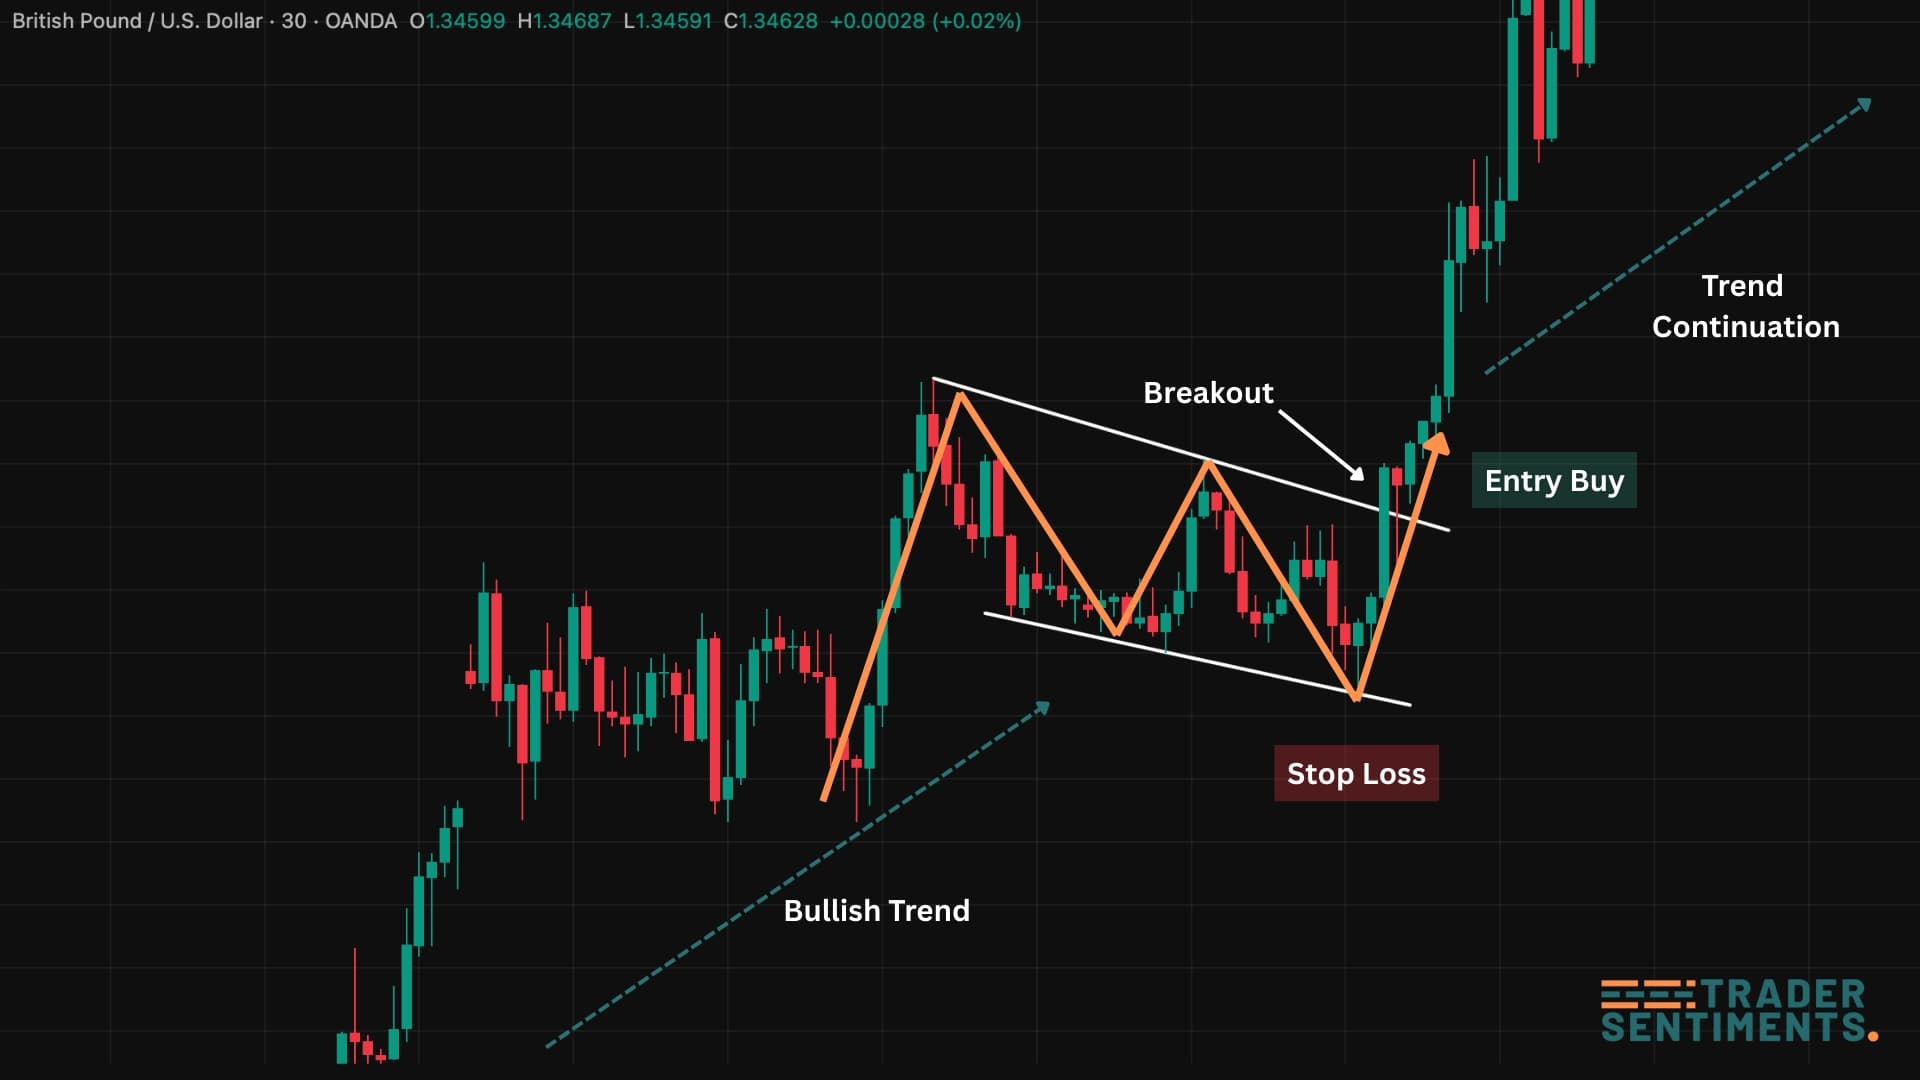
Trading the bull flag requires waiting for confirmation and using proper risk management. The breakout should be clean and accompanied by volume.
Entry rules
- Conservative entry: Wait for a candle close above the flag's upper trendline.
- Aggressive entry: Enter on the breakout retest (price pulls back to the flag's upper trendline).
- Volume confirmation: Look for increased volume on the breakout.
- Timeframe: Higher timeframes (H4, D1) provide more reliable signals.
Stop-loss placement
Place stop-loss below the flag's lowest point. This gives the pattern more room.
Place stop-loss below the flag's lower trendline. Tighter stop but higher risk of being stopped out.
Profit targets
Measure the height of the flagpole (from the start of the move to the first peak), then project that distance upward from the breakout point. This gives you a minimum target.
- Measure flagpole height = 200 pips
- Breakout occurs at 1.1200
- Minimum target = 1.1200 + 200 pips = 1.1400
Common mistakes to avoid
Wait for confirmation. Price can break down from the flag instead of breaking out.
Flags that last too long lose their continuation power and may signal a reversal instead.
Low volume on the breakout suggests weak momentum and higher failure risk.
Always use a stop-loss below the flag. Patterns can fail, and risk management is essential.