
The bear flag is a powerful bearish continuation pattern that forms when price makes a sharp downward move (the flagpole), then consolidates in a tight, slightly upward-sloping or sideways channel (the flag) before breaking lower and continuing the original downward move. It is the mirror image of the bull flag and is widely used by traders to identify high-probability short-selling opportunities within established downtrends. This guide covers the complete structure, psychology, entry techniques, and risk management for trading the bear flag.
What is a bear flag pattern?
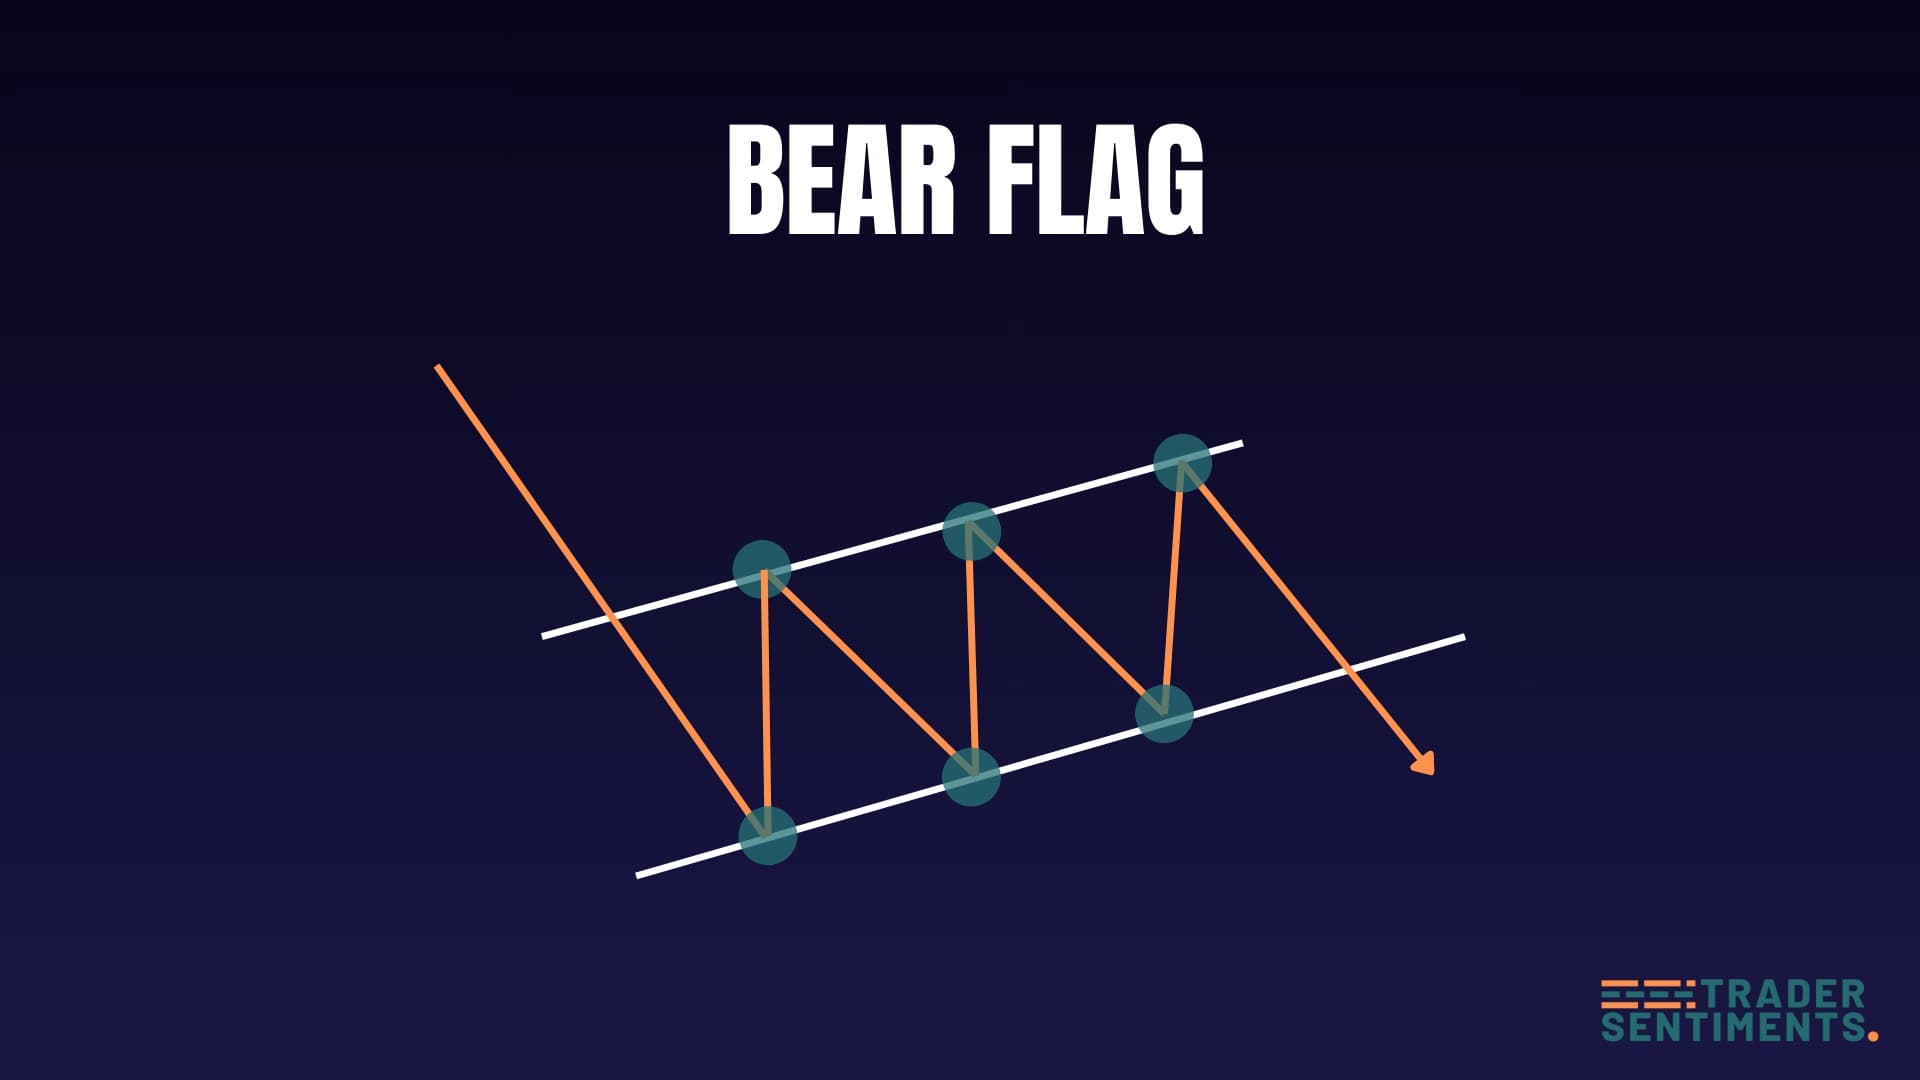
The bear flag pattern is a bearish continuation formation that occurs during a downtrend. It consists of a strong downward move (flagpole) followed by a brief consolidation in an upward-sloping or horizontal channel (flag). The pattern confirms when price breaks below the flag's lower trendline.
Pattern structure
- Flagpole: A strong, sharp downward move on high volume.
- Flag: A brief consolidation with parallel or slightly upward-sloping trendlines.
- Volume: Decreases during the flag formation.
- Breakdown: Price breaks below the flag's lower trendline with increased volume.
- Continuation: Price continues in the direction of the original trend.
How to identify the pattern
The pattern must form during a clear downtrend. The flagpole should be a strong, impulsive move.
The flag should be relatively short. Longer consolidations reduce reliability.
The flag should have clear parallel or slightly upward-sloping trendlines.
Volume should be high on the flagpole, decrease during the flag, and increase on the breakdown.
Trading the pattern
Entry rules
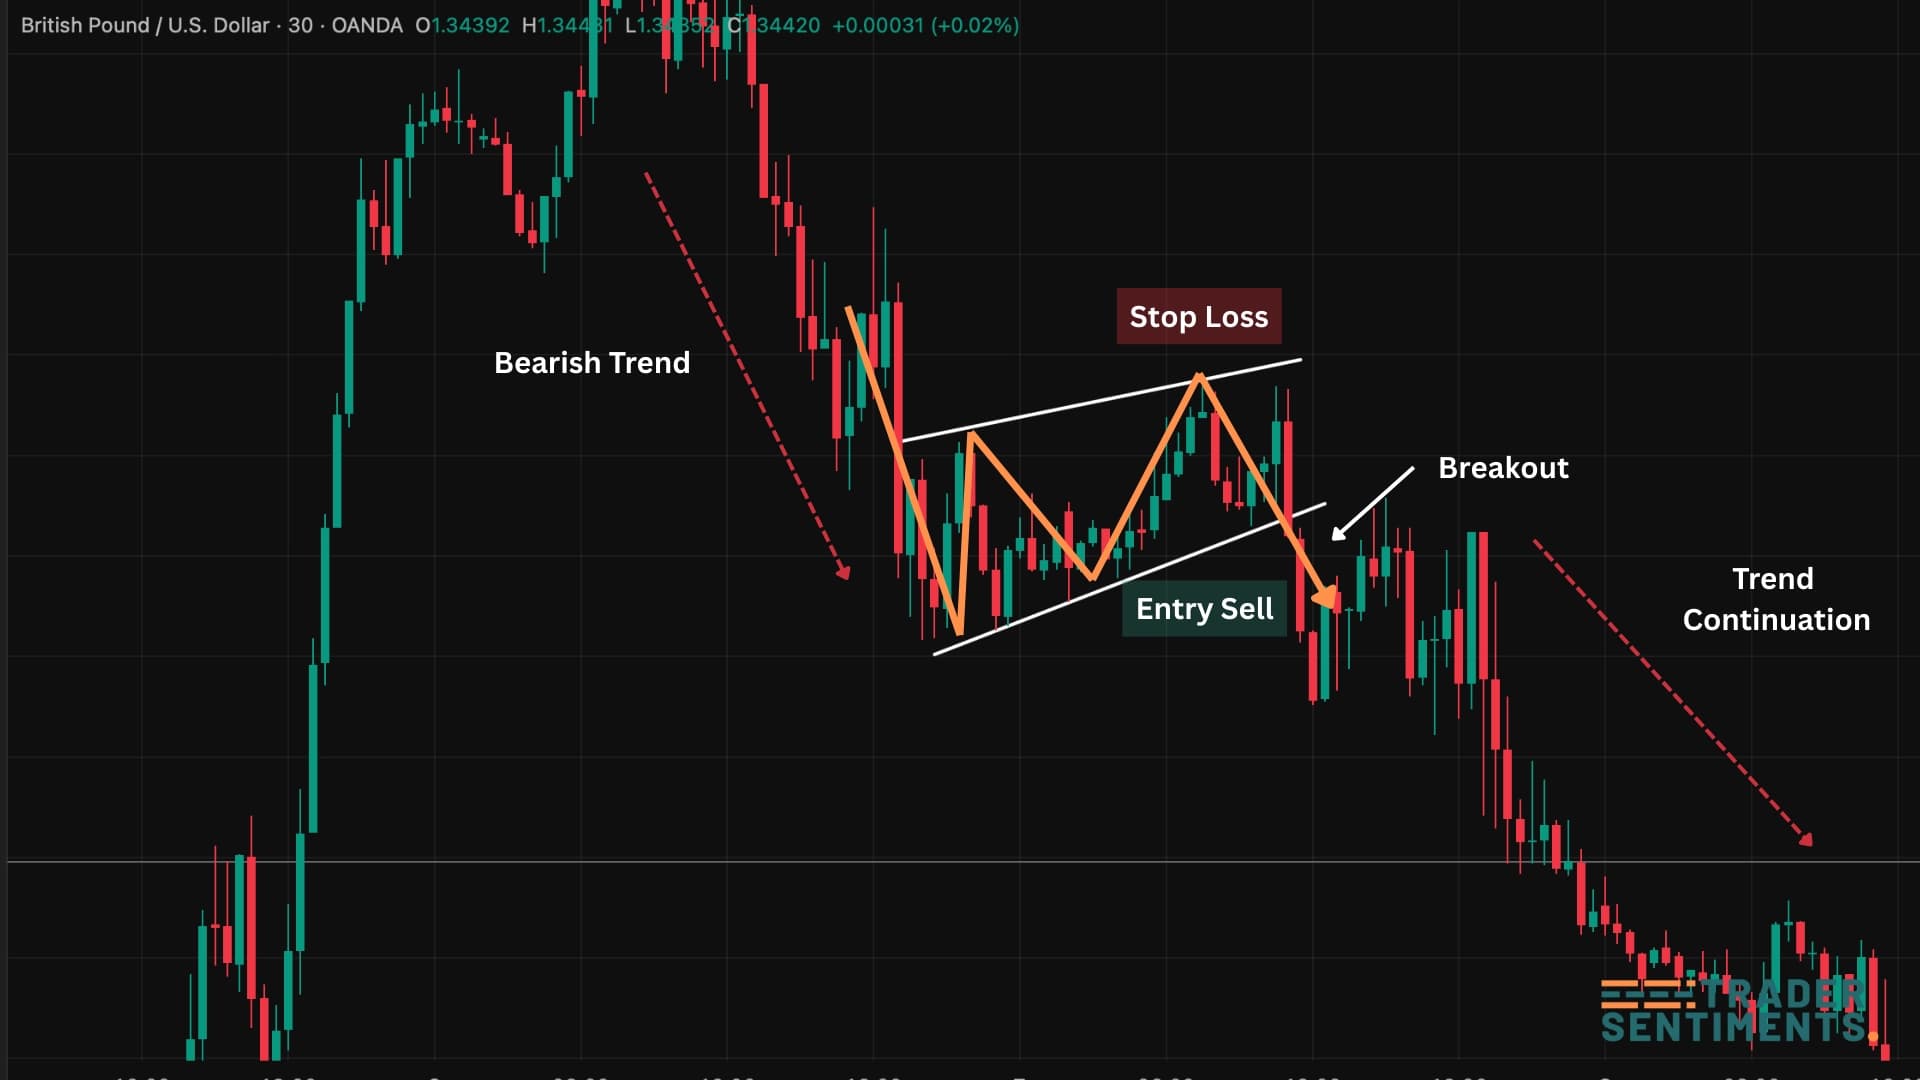
- Conservative entry: Wait for a candle close below the flag's lower trendline.
- Aggressive entry: Enter on the breakdown retest.
- Volume confirmation: Look for increased volume on the breakdown.
- Timeframe: Higher timeframes (H4, D1) provide more reliable signals.
Stop-loss placement
Place stop-loss above the flag's highest point.
Place stop-loss above the flag's upper trendline.
Profit targets
Measure the height of the flagpole, then project that distance downward from the breakdown point.
- Measure flagpole height = 200 pips
- Breakdown occurs at 1.1000
- Minimum target = 1.1000 - 200 pips = 1.0800
Common mistakes to avoid
Wait for confirmation. Price can break upward from the flag instead.
Flags that last too long lose their continuation power.
Low volume on the breakdown suggests weak momentum.
Always use a stop-loss. Patterns can fail.