
The ascending triangle is a widely recognized bullish continuation pattern, and sometimes a reversal, defined by a flat upper resistance line and a rising lower trendline. Each touch of the flat resistance absorbs more supply, while rising lows show buyers growing increasingly aggressive. When resistance finally breaks, the result is often a sharp, high-momentum move. This guide covers everything traders need to know about identifying, trading, and managing risk on the ascending triangle.
What is an ascending triangle?
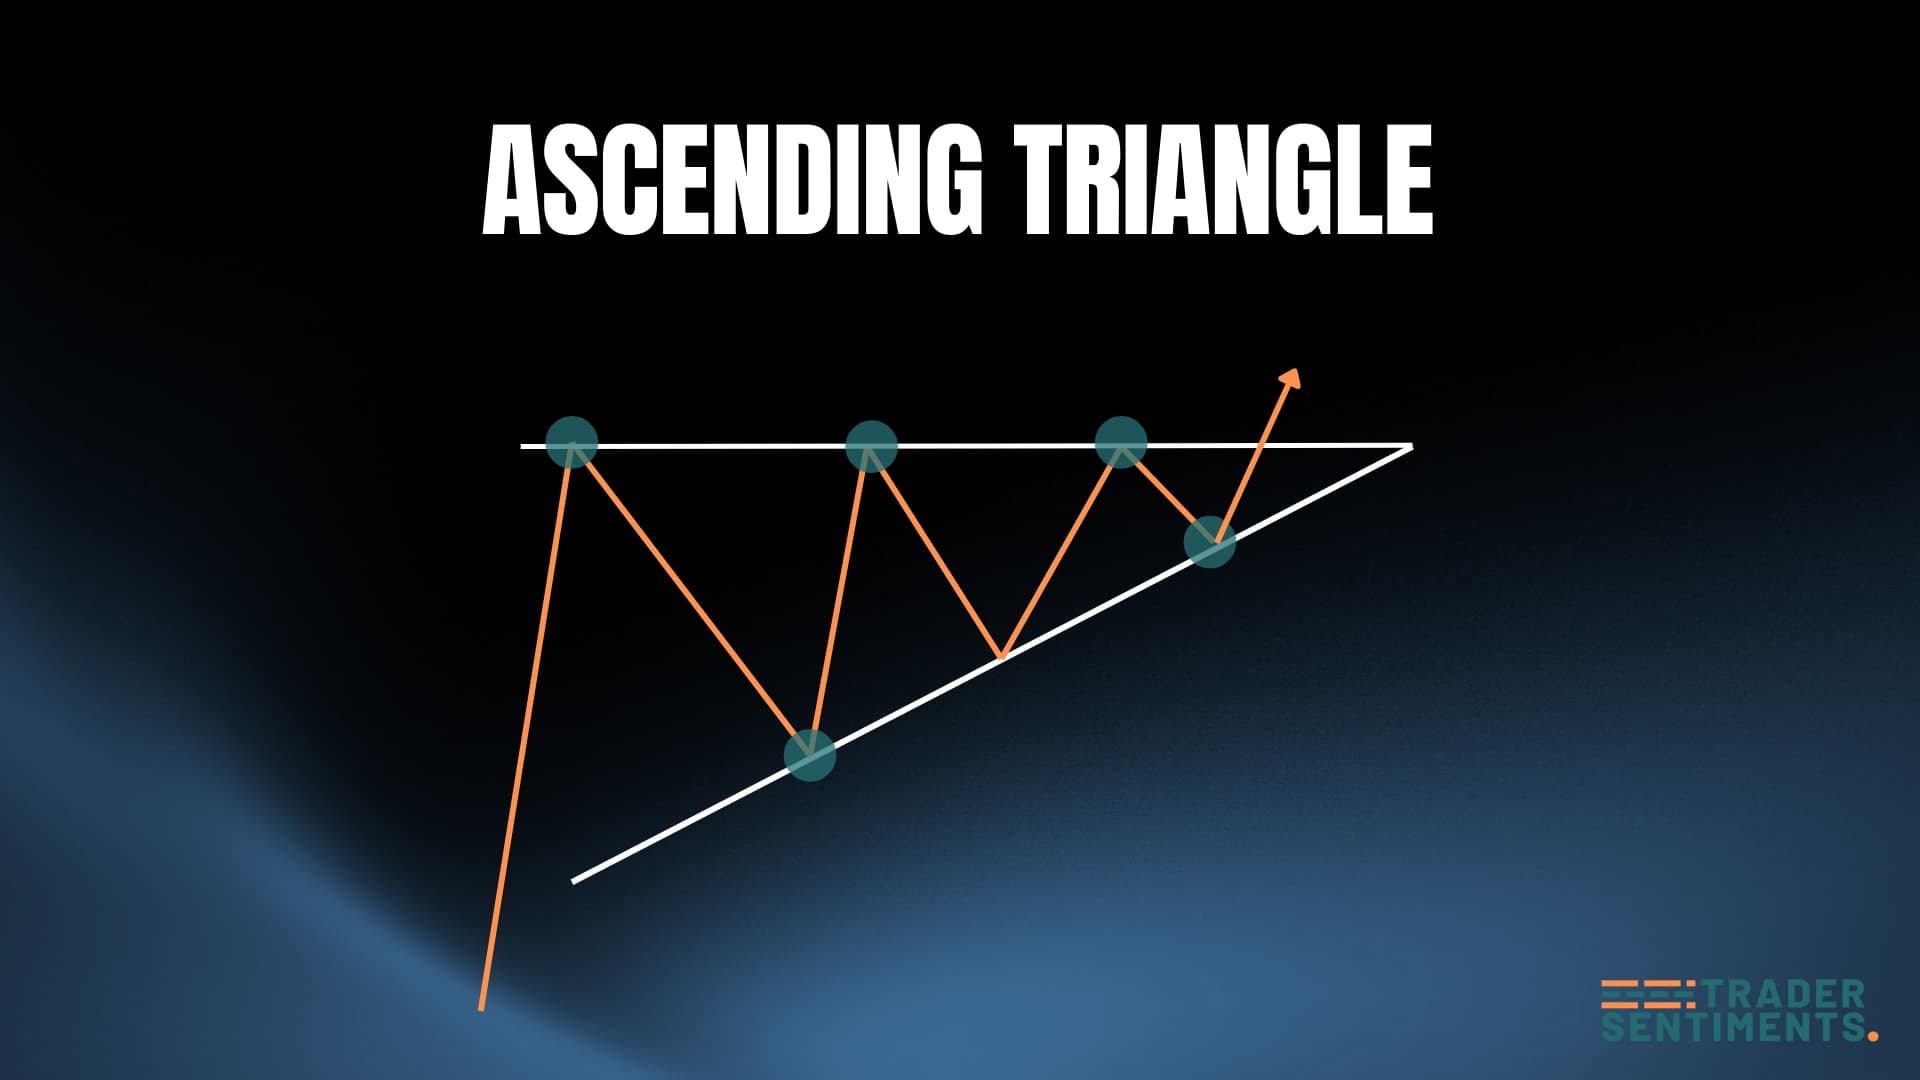
The ascending triangle is a bullish continuation pattern that forms when price consolidates between a flat horizontal resistance and a rising support line. Buyers become increasingly aggressive, pushing lows higher while resistance holds temporarily before breaking out upward.
Pattern structure
- Flat resistance: A horizontal line connecting at least two highs at the same level.
- Rising support: An upward-sloping line connecting higher lows.
- Consolidation: Price bounces between these lines, forming the triangle.
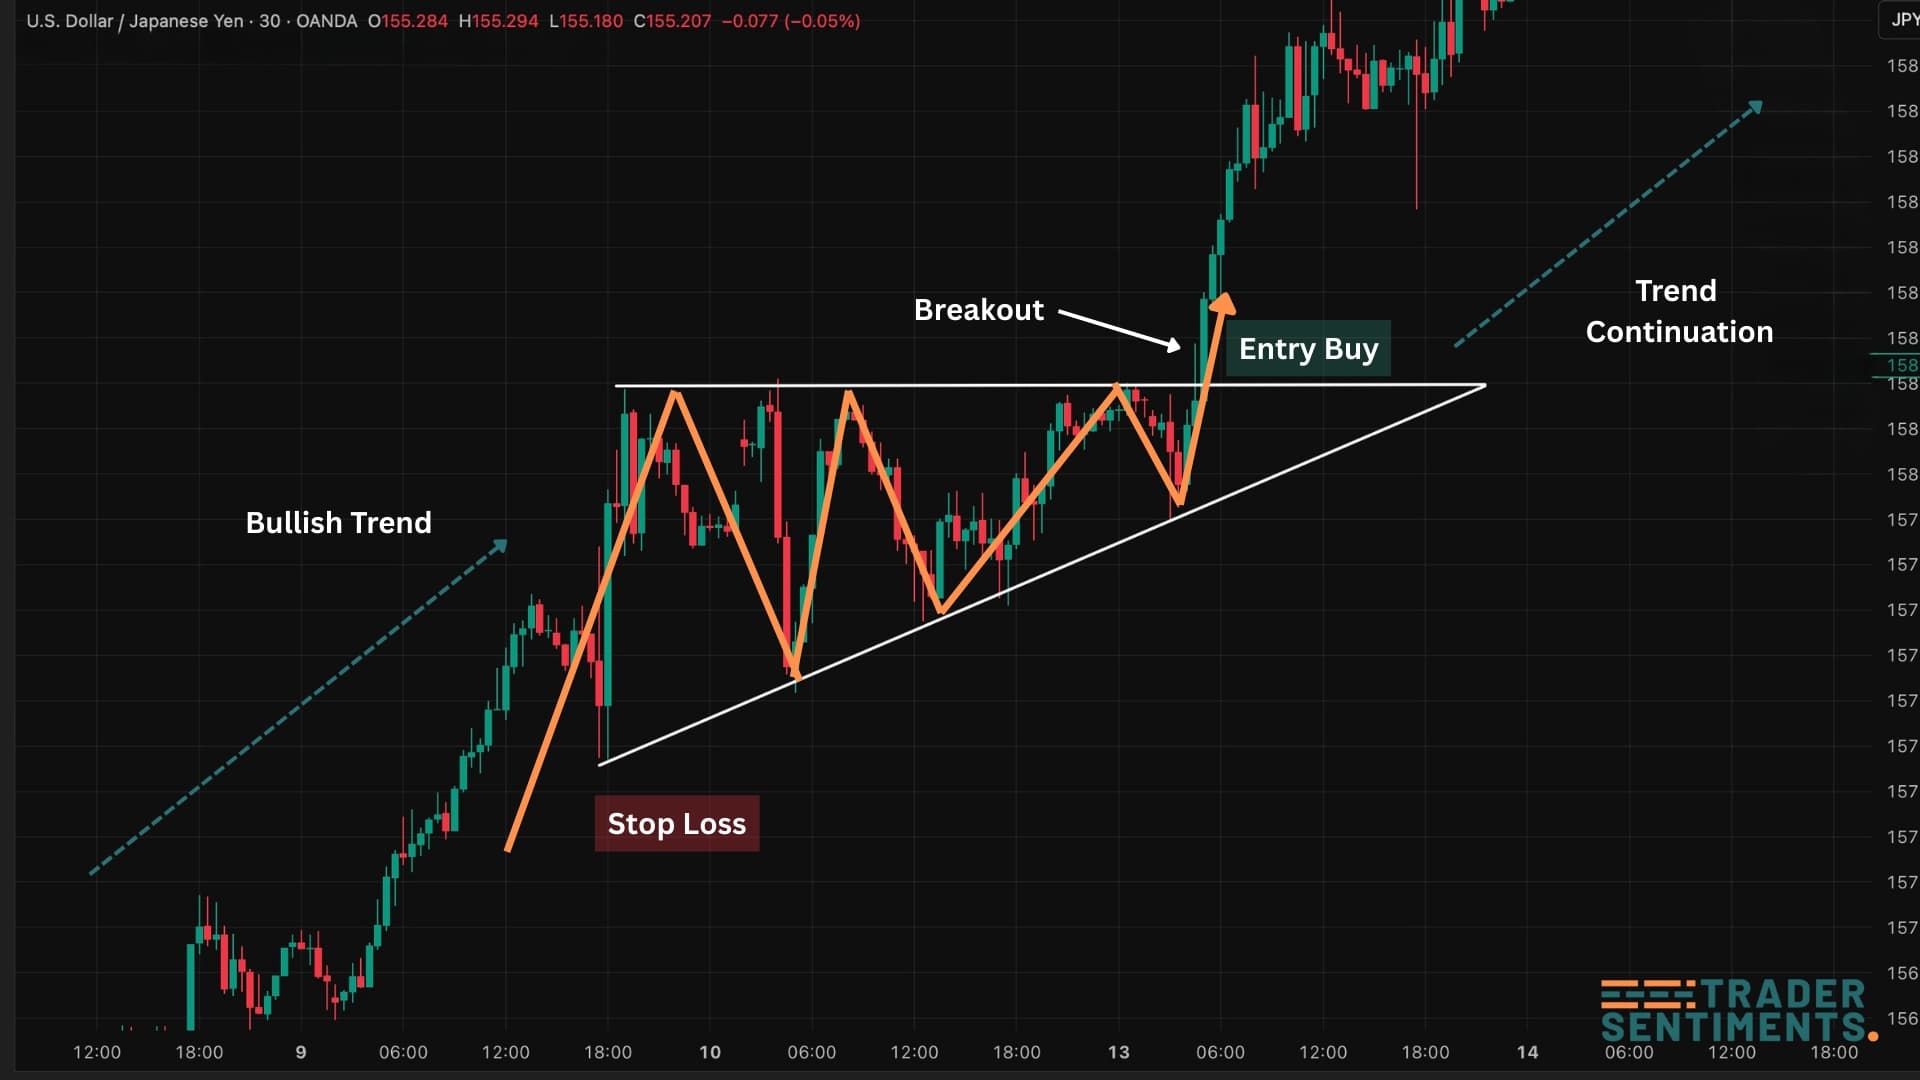
- Breakout: Price breaks above resistance with increased volume.
- Continuation: Uptrend resumes after breakout.
How to identify the pattern
Pattern should form during an uptrend as a continuation signal.
Resistance and support lines need at least 2 touches each to be valid.
Each low should be higher than the previous, showing buying pressure.
Volume decreases during consolidation, increases on breakout.
Trading the pattern
Entry rules
- Conservative: Wait for candle close above resistance.
- Aggressive: Enter on breakout retest.
- Volume: Confirm with increased volume on breakout.
- Timeframe: H4 and D1 are most reliable.
Stop-loss placement
Below the most recent higher low.
Below the ascending support line.
Profit targets
Measure triangle height at widest point, project upward from breakout.
- Triangle height = 150 pips
- Breakout at 1.1000
- Target = 1.1150
Common mistakes
Wait for confirmation.
Low volume breakouts often fail.
Always protect your capital.