Keltner Channels are a volatility-based envelope built around an EMA, with channel width driven by ATR. Traders use them to identify trend strength, spot breakouts, and manage trades with structure-based risk rules.
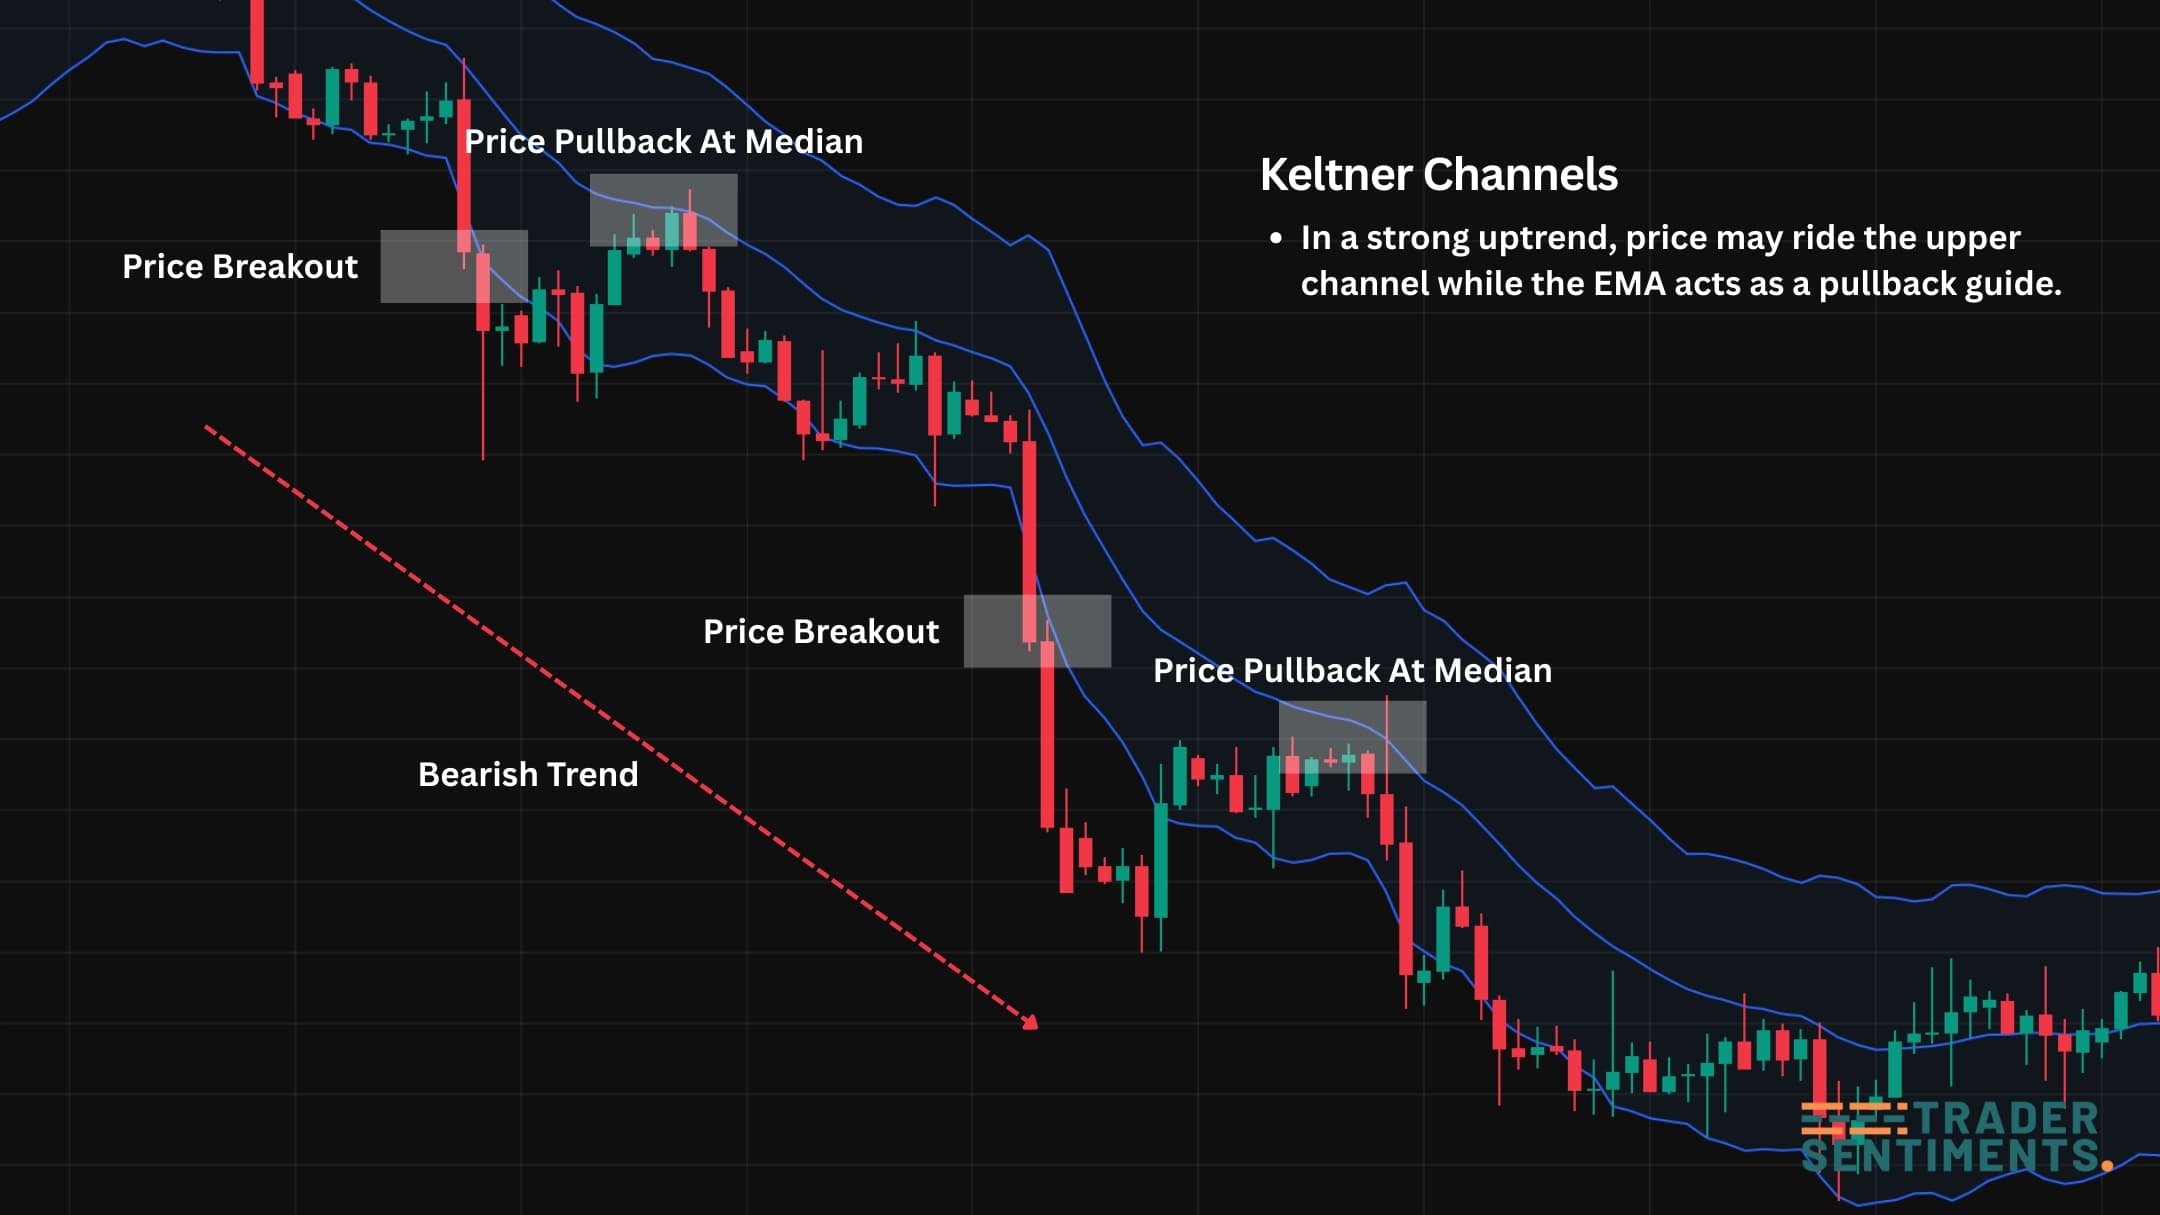
Example: in a strong uptrend, price may ride the upper channel while the EMA acts as a pullback guide.
Keltner Channels explained
Keltner Channels combine direction (EMA) and volatility (ATR) into a simple envelope. If price is consistently outside or near the upper band, it suggests bullish pressure. If price is consistently near the lower band, it suggests bearish pressure.
Traders use Keltner Channels to:
- Filter trend strength (price riding bands vs chopping around the EMA)
- Define entries on pullbacks (EMA/midline as a decision area)
- Spot volatility expansion (breaks outside the channel after compression)
- Place stops using ATR logic (channel width already “bakes in” volatility)
How Keltner Channels are calculated
Keltner Channels are usually built with an EMA and ATR:
- Middle line: EMA(N)
- Upper band: EMA(N) + (ATR(N) × Multiplier)
- Lower band: EMA(N) − (ATR(N) × Multiplier)
Typical settings are EMA 20, ATR 10, multiplier 2. Shorter periods react faster (more noise). Longer periods are smoother (more lag).
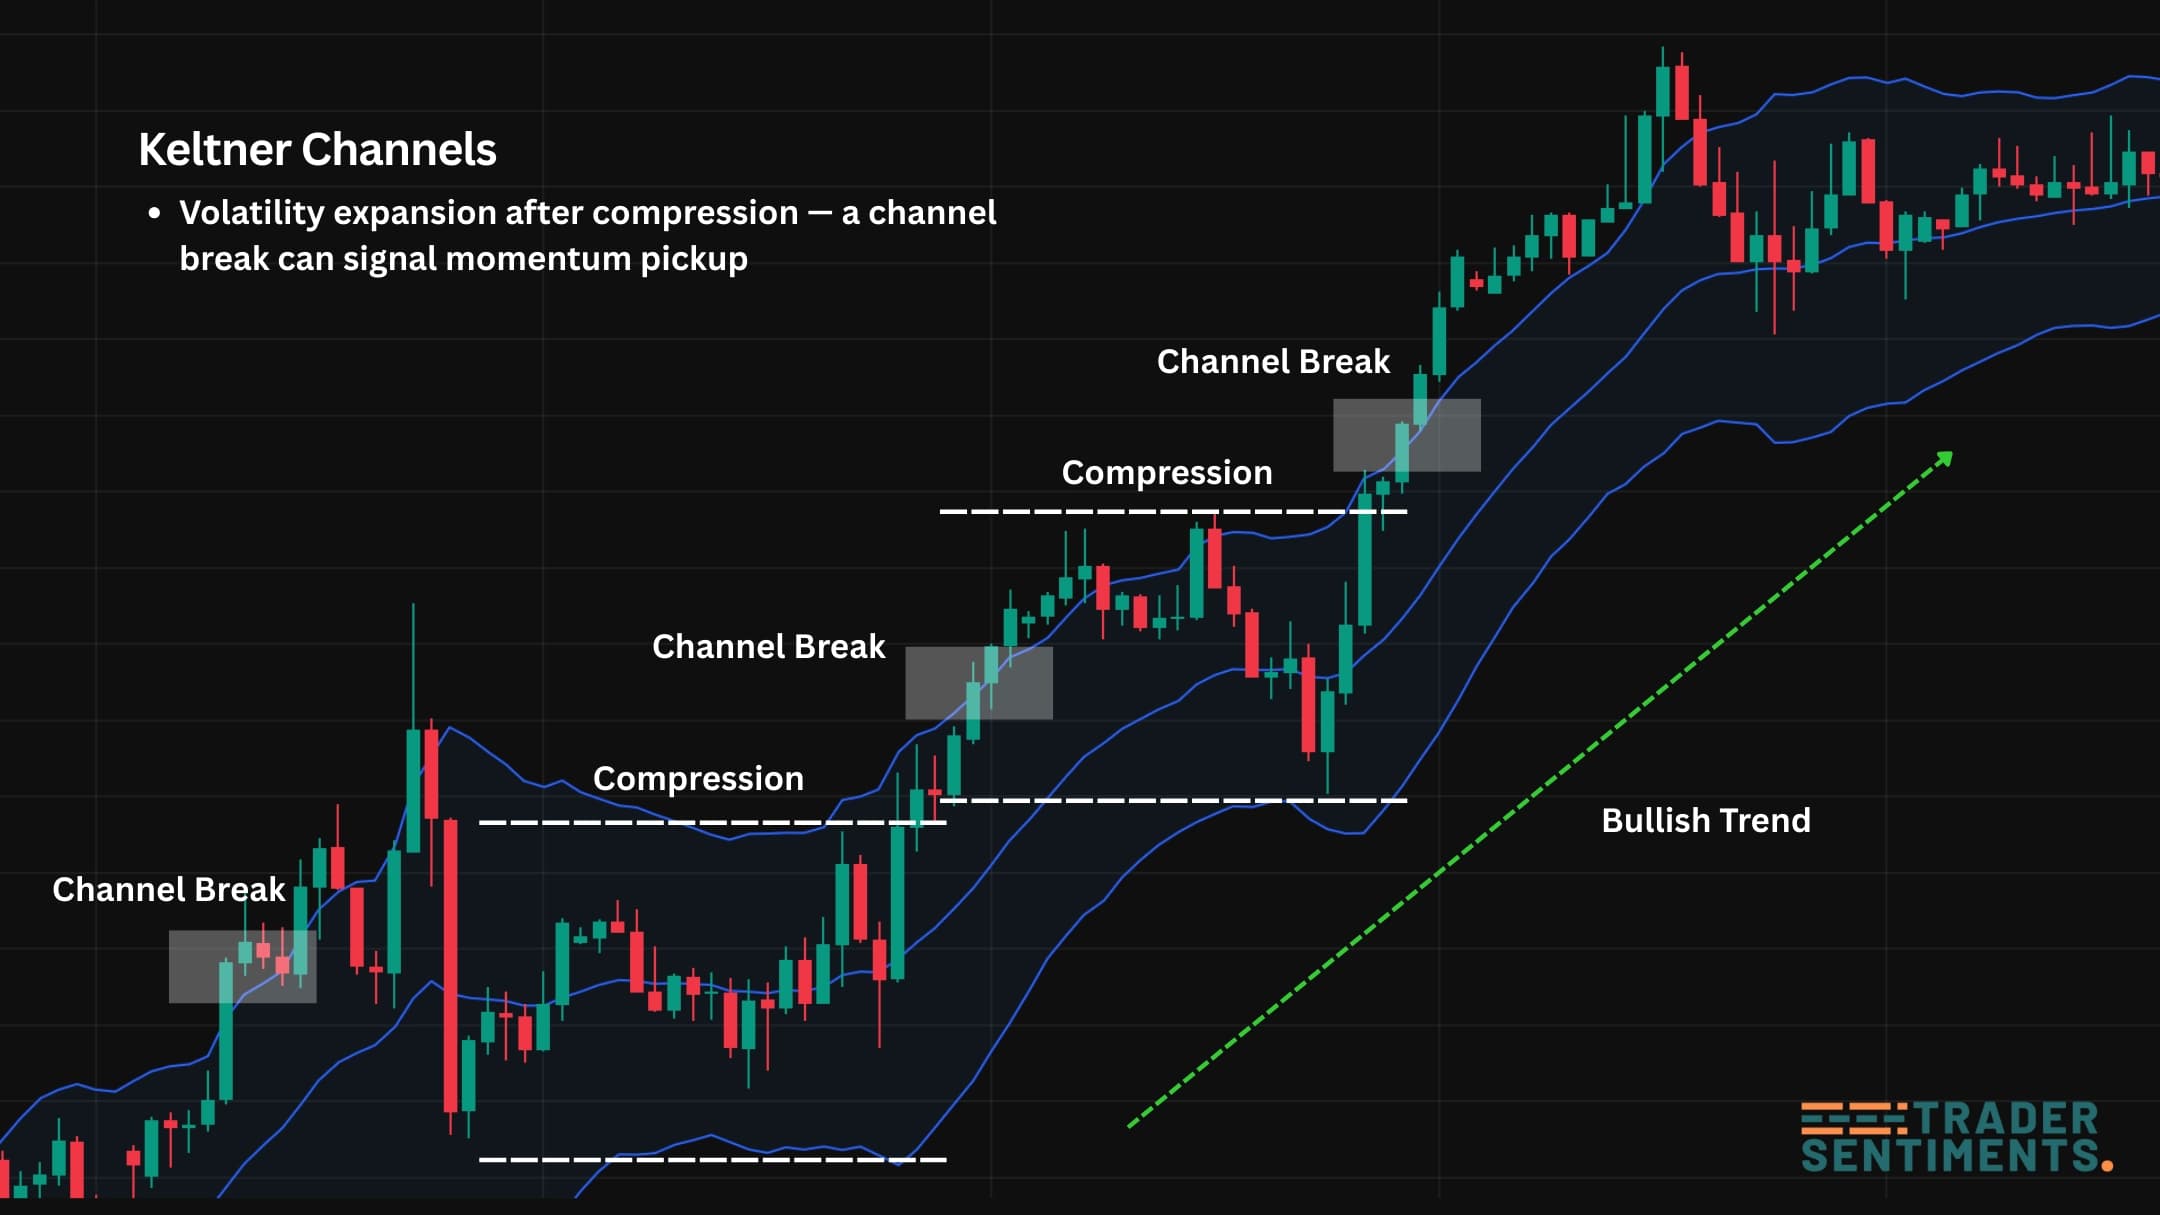
Example: volatility expansion after compression — a channel break can signal momentum pickup.
How to read Keltner Channels
Read Keltner Channels as a “trend + volatility map.” The EMA shows baseline direction, while the channel width shows typical price movement around that baseline.
In a strong trend, price often stays on one side of the EMA and frequently taps or rides the outer band. Pullbacks that hold near the EMA can be continuation zones.
In a range, price crosses the EMA repeatedly and the channel is less directional. Breakouts fail more often when volatility is low and structure is flat.
Tip: Combine Keltner Channels with market structure (support/resistance or HH/HL logic). Channels help with timing; structure helps with context.
Trading strategies with Keltner Channels
Identify trend direction (higher timeframe helps). In bullish conditions, look for pullbacks toward the EMA and entries on confirmation (reclaim/hold). Manage risk with structure invalidation.
After compression (narrow channel), a strong close outside the band can signal expansion. Many traders wait for follow-through or a retest to reduce false breaks.
In a clear range, traders may fade touches of the outer band back toward the EMA. This needs strong range boundaries and strict invalidation rules because trend breakouts punish fades.
Risk management and common mistakes
Keltner Channels aren’t a “buy/sell” button. Your edge comes from rules: entries, stops, sizing, and discipline.
- Trading every band touch without checking trend structure
- Using tight stops in high volatility environments
- Ignoring session/news effects (ATR spikes)
- Overleveraging because signals “look clean”
- Not adapting settings for timeframe (M5 vs H4)
Risk a fixed % per trade (example: 0.5%–1%). Place stops where your idea is invalidated (structure), then size position so the stop distance fits your risk.