The Exponential Moving Average (EMA) is a moving average that reacts faster to recent prices than a simple moving average. Traders use EMAs to confirm trend direction, find pullback entries, and manage exits with clear rules.
EMA explained
EMA is popular because it reacts faster to new price information. This makes it useful for:
- Confirming trend direction and momentum
- Filtering trades (avoid counter-trend entries)
- Finding pullback entries in strong trends
- Using EMA as a dynamic “zone” for support/resistance
- Trailing exits when a trend is strong
Most traders don’t treat EMA as a single “signal line”. It works best when you combine it with structure (support/resistance, swings, trendlines) and risk rules.
How EMA works
EMA calculates an average price, but it gives more importance to the most recent candles. This is why EMA turns faster than SMA when the market changes direction.
- EMA sloping up: bullish bias, momentum is rising.
- EMA sloping down: bearish bias, momentum is weakening.
- Price repeatedly respecting EMA: trend is strong, pullbacks are controlled.
- Price chopping through EMA: ranging/unclear market, reduce EMA-only signals.
Best EMA settings (9/20/50/200)
EMA settings are not “magic numbers”. Use settings that match your timeframe and holding period. Here’s how traders commonly use them:
Very short momentum line. Common in scalping/day trading. Signals quickly but whipsaws more.
Popular pullback EMA. Used as a dynamic zone in trending markets.
Medium trend filter. Helps confirm direction and avoid weak counter-trend entries.
Long-term bias. Many traders avoid longs below it and shorts above it.
How traders use EMA
The best way to use EMA is as a “framework” — not a single buy/sell button. Common uses:
- Trend filter: Only buy when price is above 200 EMA (and EMA is sloping up).
- Pullback zone: Wait for a pullback into 20/50 EMA area, then confirm rejection.
- Momentum confirmation: When price holds above EMA after a breakout, trend is healthier.
- Exit logic: Exit after a strong close below EMA or after structure breaks.
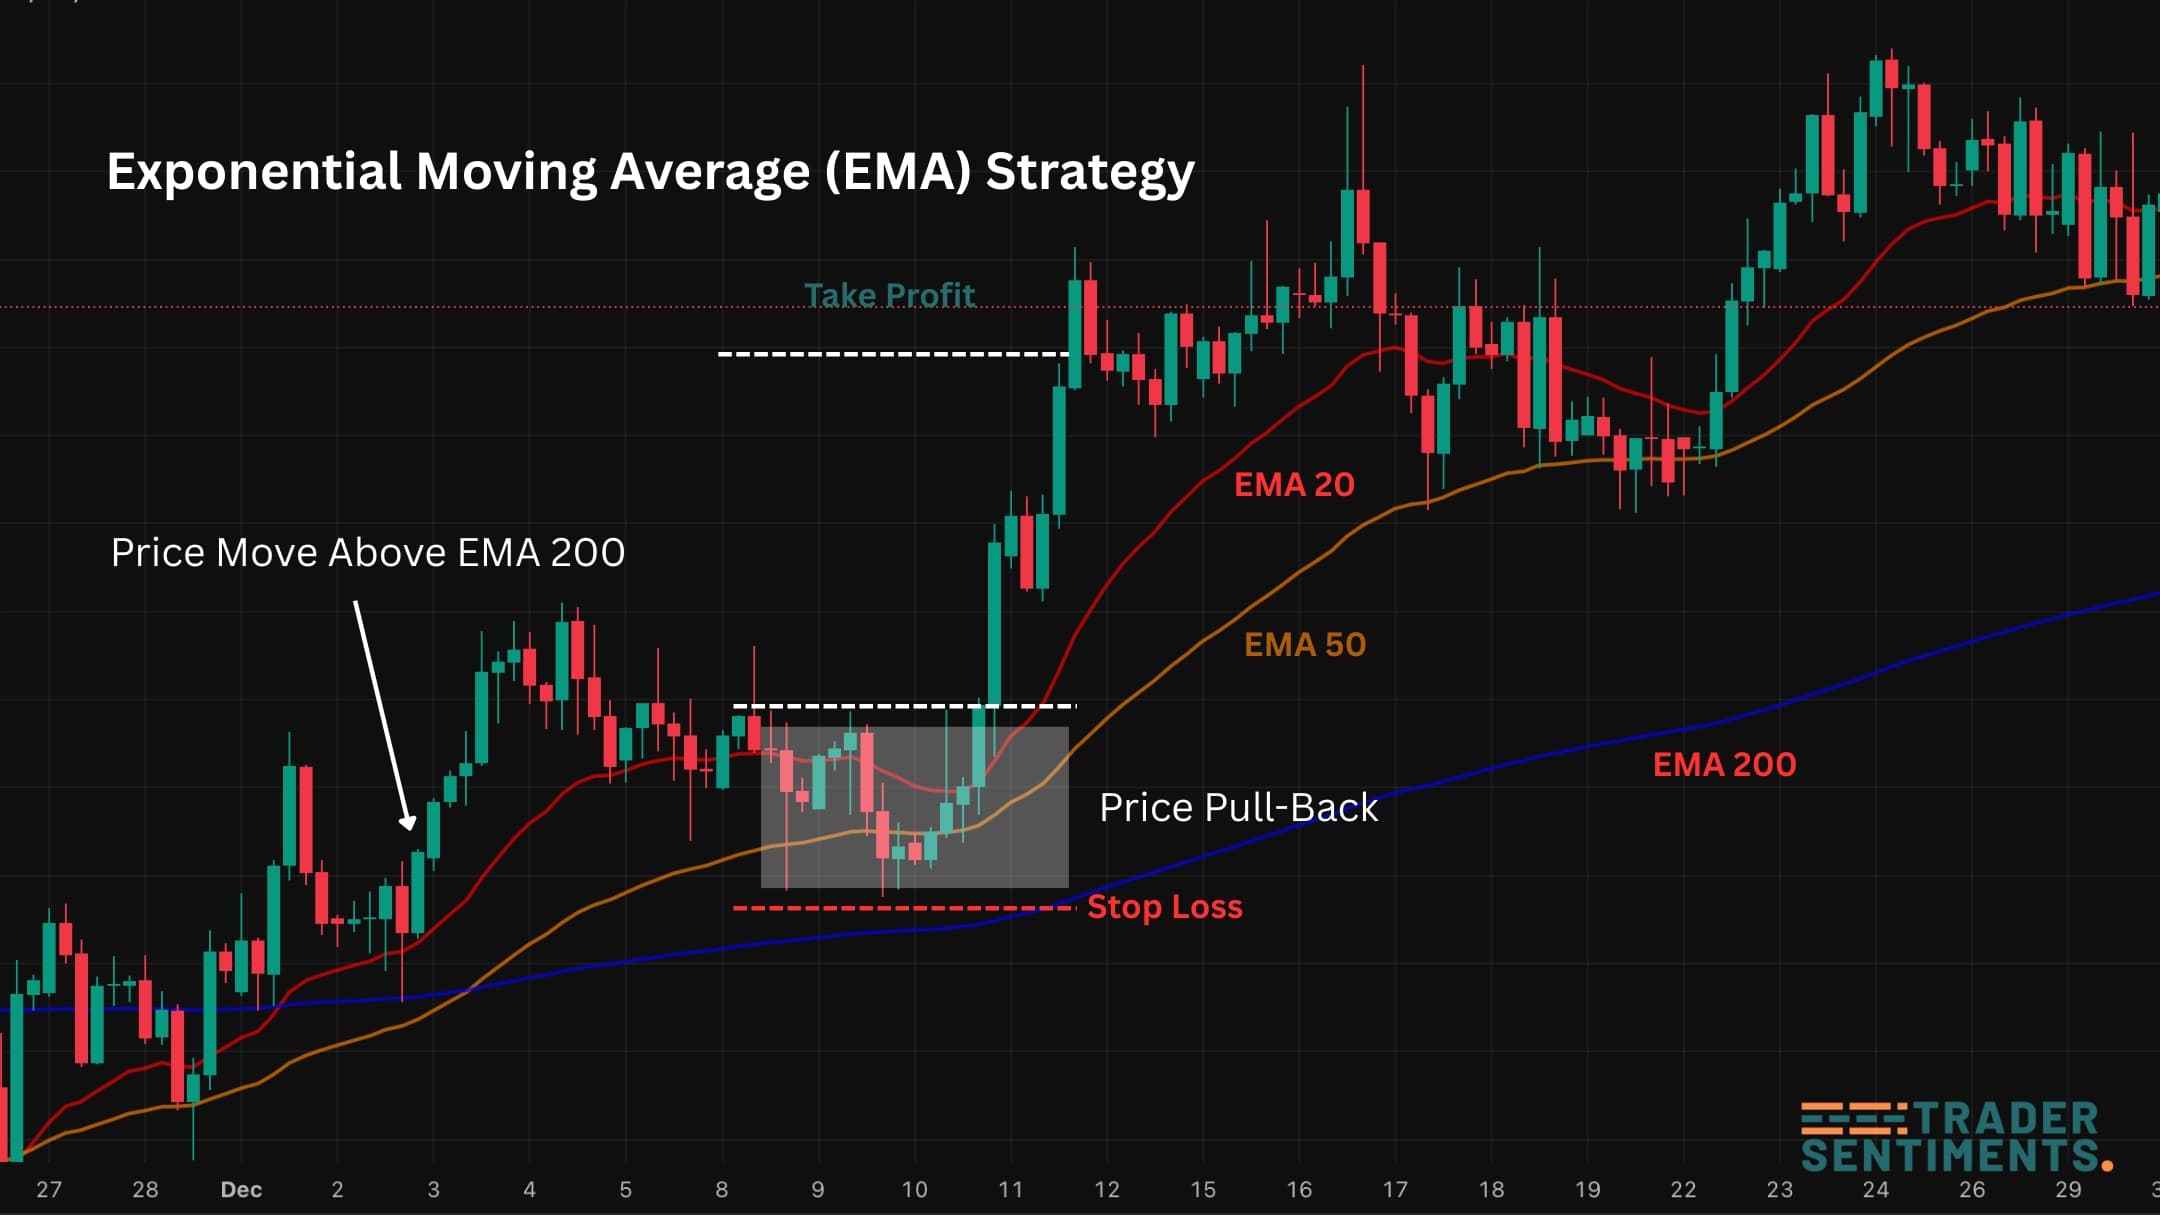
Example: trend filter + pullback into EMA zone.
EMA strategies (rules-based)
- Bias: Only buy above 200 EMA (sloping up)
- Setup: Pullback into 20 EMA zone
- Trigger: Rejection candle or structure reclaim
- Stop: Below pullback swing low
- Target: Prior high or next resistance level
- Bias: Only trade in a clear trend and liquid sessions
- Entry: After a breakout, enter when price reclaims 9 EMA
- Stop: Tight stop below recent swing
- Warning: Avoid ranging markets — whipsaw risk is high
A bullish signal occurs when 20 EMA crosses above 50 EMA, bearish when it crosses below. This works best when the market is already trending and you add filters like structure, volatility (ATR), and higher-timeframe alignment.
Risk management with EMA
EMA helps with structure and entries, but risk management keeps the account alive. Practical rules:
- Risk a fixed % per trade (example: 0.5%–1%)
- Stops must be beyond invalidation (not “just below EMA”)
- Don’t increase size after losses
- Limit correlation risk (many USD trades at once)
- Take partial at key resistance/support
- Trail behind structure or behind a chosen EMA
- Exit if trend breaks on higher timeframe
- Respect major news (spreads/slippage can spike)
Common mistakes & filters
- Entering late: buying far above EMA after a big run.
- Ignoring structure: EMA is not a perfect level — confirm with zones and swings.
- Trading chop: if price keeps crossing EMA, reduce EMA-only trades.
- No volatility filter: low volatility creates weak follow-through.
Helpful filters: higher-timeframe trend alignment, key support/resistance, session timing, ATR-based volatility checks, and avoiding big news spikes.