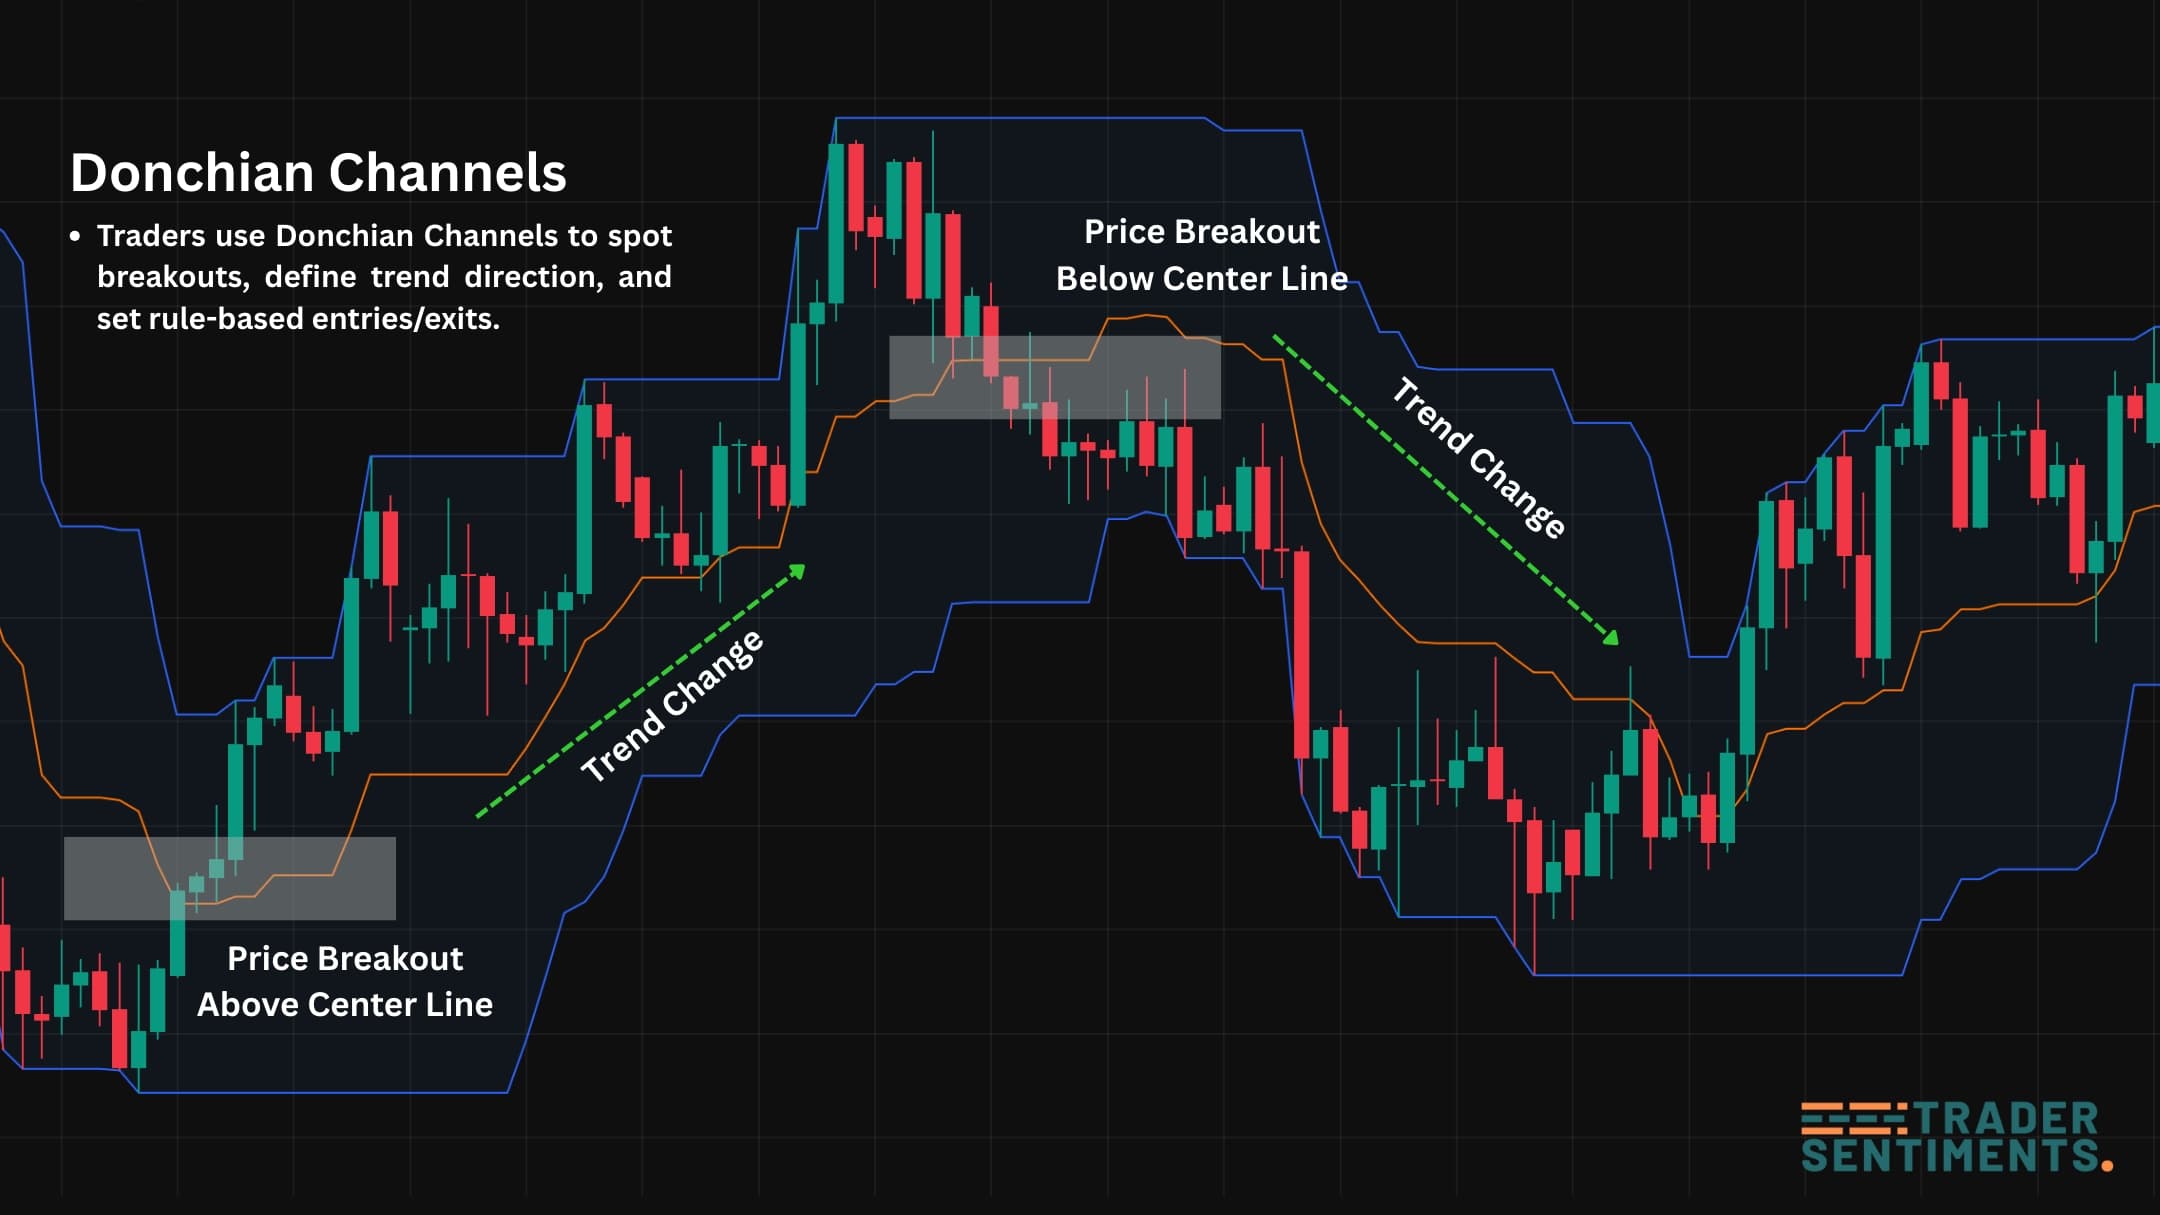
Donchian Channels are a simple price channel indicator built from the highest high and lowest low over a chosen period (commonly 20). Traders use Donchian Channels to spot breakouts, define trend direction, and set rule-based entries/exits — including classic trend-following systems like Turtle Trading. This guide explains the Donchian Channel formula, how to read the bands, practical strategies, and risk management.
Example: price breaking above the upper band can signal a breakout; exits and filters matter.
Donchian Channels explained
Donchian Channels are built from price extremes: the highest high and lowest low over a lookback window. This makes them naturally suited for breakout and trend-following styles. When price expands beyond recent extremes, it can signal a new directional move.
- Breakout signals: new highs / new lows
- Trend framing: price holding near the upper/lower band
- Rule-based exits: opposite band breaks or trailing rules
- Stop placement reference (with structure/ATR filters)
Donchian Channel formula and calculation
The Donchian Channel formula is simple and transparent:
- Upper band: Highest High over N periods
- Lower band: Lowest Low over N periods
- Middle band (optional): (Upper + Lower) / 2
Because it uses extremes, Donchian Channels naturally expand during trends and stay tighter during ranges.
Best settings and variations
A popular baseline is Donchian (20). It reacts enough to catch moves but isn’t too noisy.
Balanced breakout/trend reference. Best starting point.
More signals, more whipsaw. Needs stronger filters.
Trend capture focus, fewer trades, smoother behavior.
How to read Donchian Channels
Donchian Channels are easiest to read using context: is the market ranging or trending?
New highs over N periods. This can signal a breakout or trend continuation.
New lows over N periods. This can signal a bearish breakout or trend continuation.
In trends, price may stay close to one band for long periods. Fading that momentum is risky.
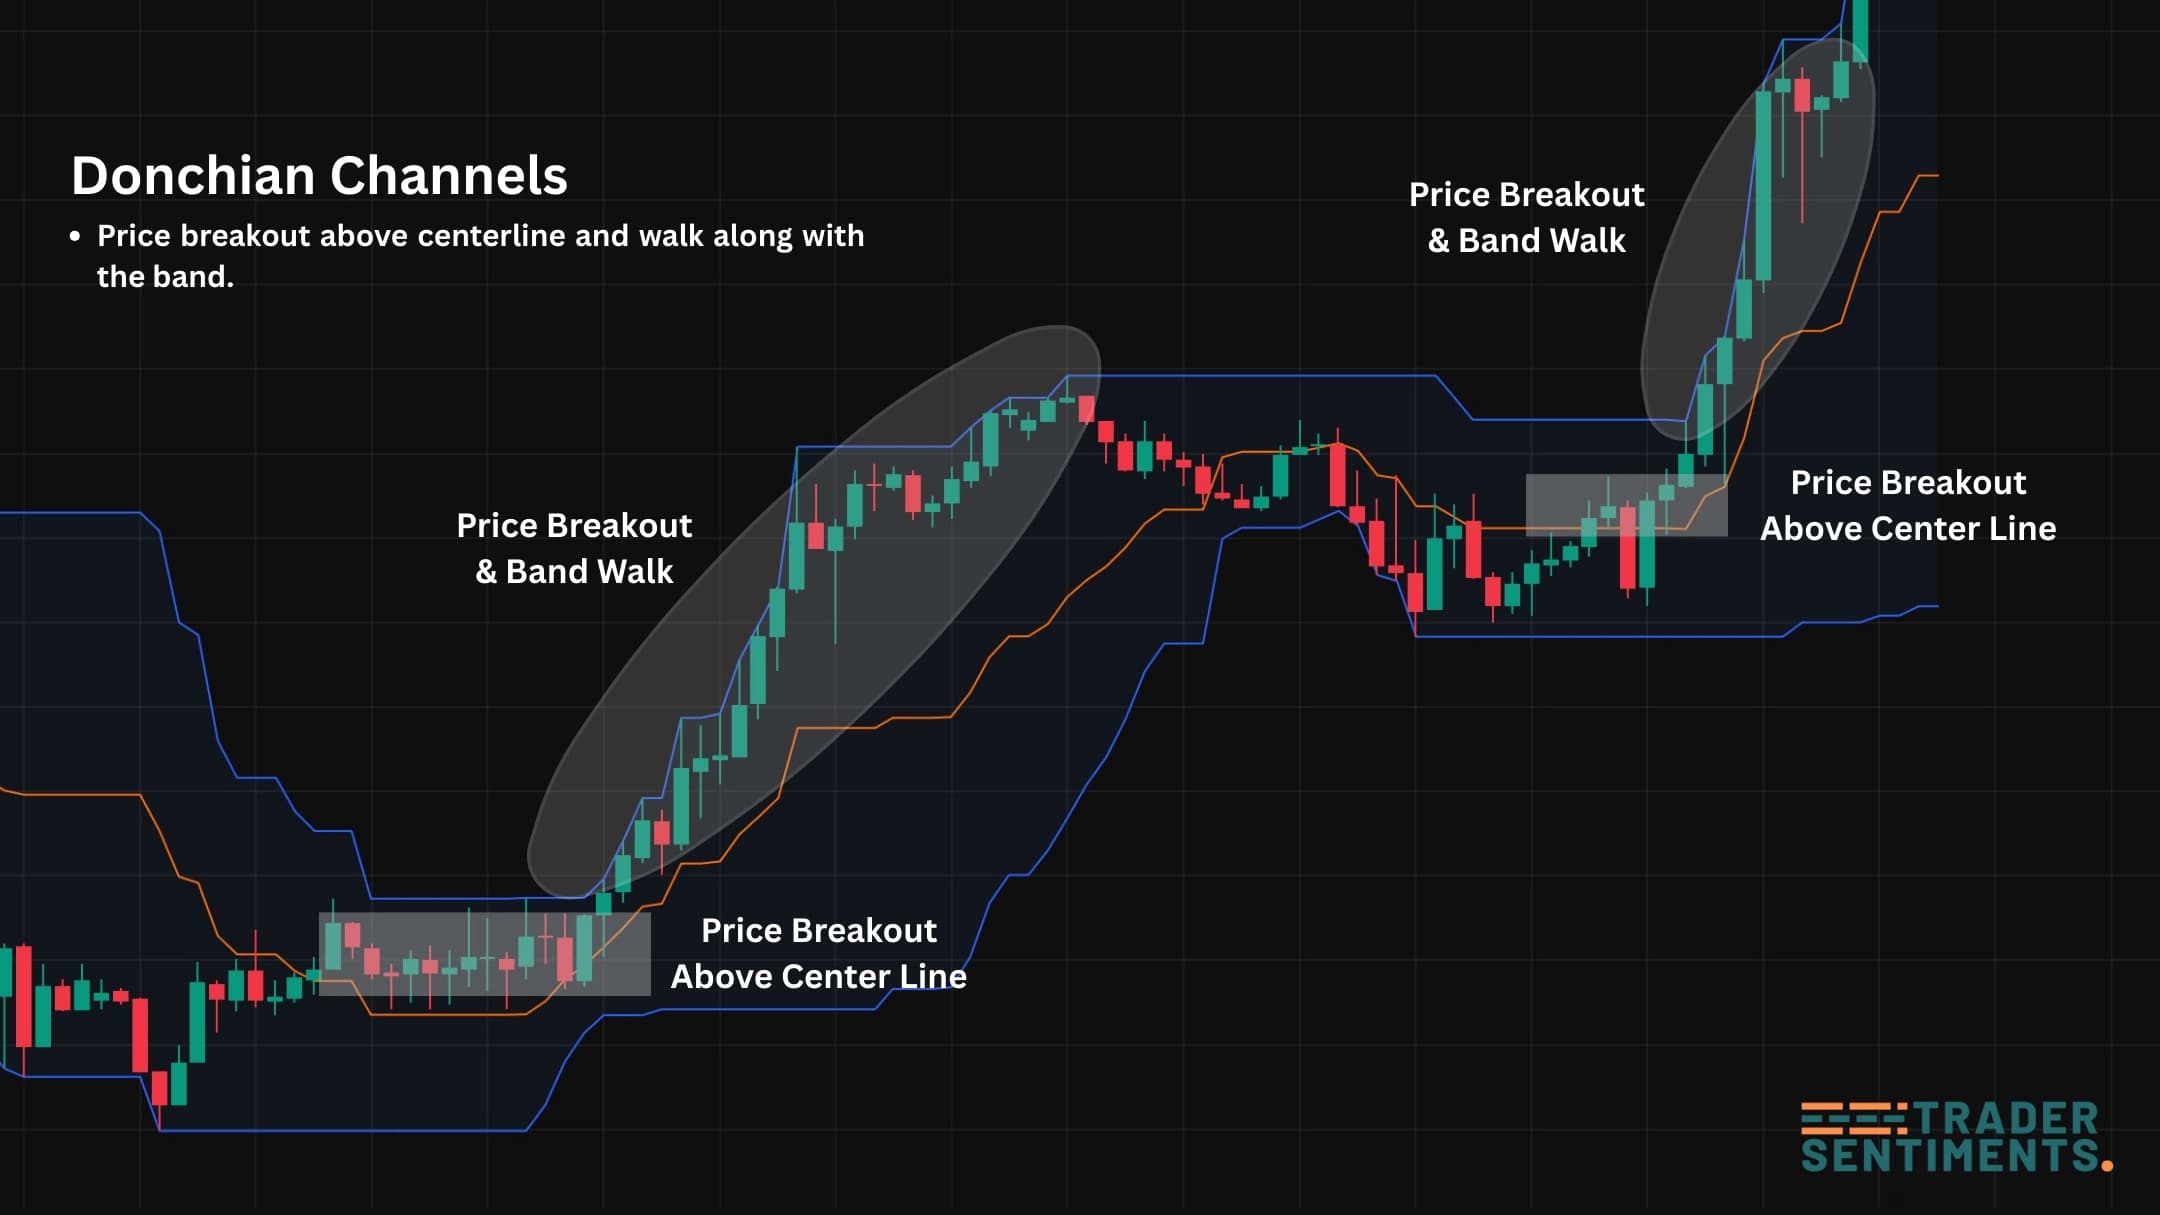
Example: band-walks in trends.
Donchian breakout strategy (rules)
A classic Donchian breakout rule: trade a break of the channel, then manage risk with a defined invalidation.
- Setup: price consolidates and channel tightens
- Entry: close above upper band (long) or below lower band (short)
- Stop: beyond structure (swing) or a volatility buffer (ATR)
- Exit: trailing stop, opposite band break, or scaled targets
- Filter: avoid major news spikes unless that’s your edge
Trend-following strategy (Turtle-style rules)
Donchian Channels are famous in trend-following systems (often called Turtle-style rules). The main idea: enter breakouts and hold winners, exit on a meaningful opposite move.
- Entry: break above upper band (N) for long; below lower band for short
- Risk: fixed % per trade; position size adjusted by volatility
- Exit: break of the opposite band using a shorter lookback (example: 10)
- Goal: capture big trends; accept small losses as cost of entries
Stops, exits, and risk management
- Beyond swing structure (clean invalidation)
- ATR buffer stop (volatility-based distance)
- Opposite band exit (system-style)
- Risk 0.5%–1% per trade
- Don’t add size emotionally — scale only by rules
- Expect whipsaws in ranges; use filters
- Trail behind structure (swing highs/lows)
- Opposite band break (system exit)
- Scale out at key levels, then trail remainder
Donchian Channels vs Bollinger Bands
These two tools are both “channels”, but they measure different things.
- Donchian: highest high / lowest low extremes → breakout & trend structure.
- Bollinger: moving average + standard deviation → volatility & mean context.
- Trading: Donchian is often better for trend-following; Bollinger is often better for squeeze/mean reversion frameworks.
Common mistakes and filters
- Taking every breakout in choppy ranges
- Stops too tight inside normal volatility
- Ignoring major news spikes and spread widening
- Not sizing down when volatility expands
- Higher-timeframe trend bias
- ATR/volatility regime (avoid extreme spikes)
- Session timing (avoid dead hours)
- Structure confirmation (BOS / range break)