Average True Range (ATR) is a volatility indicator that measures how much price typically moves over a period (commonly ATR 14). ATR does not predict direction. Traders use ATR to measure volatility, set smarter stop-loss distance, normalize risk with position sizing, and avoid tight stops during high-volatility conditions.
The key idea is simple: volatility changes. When volatility rises, candle ranges expand and stop-losses need more room. When volatility falls, markets compress and breakouts become less frequent. ATR helps you adjust risk rules to the current environment instead of guessing.
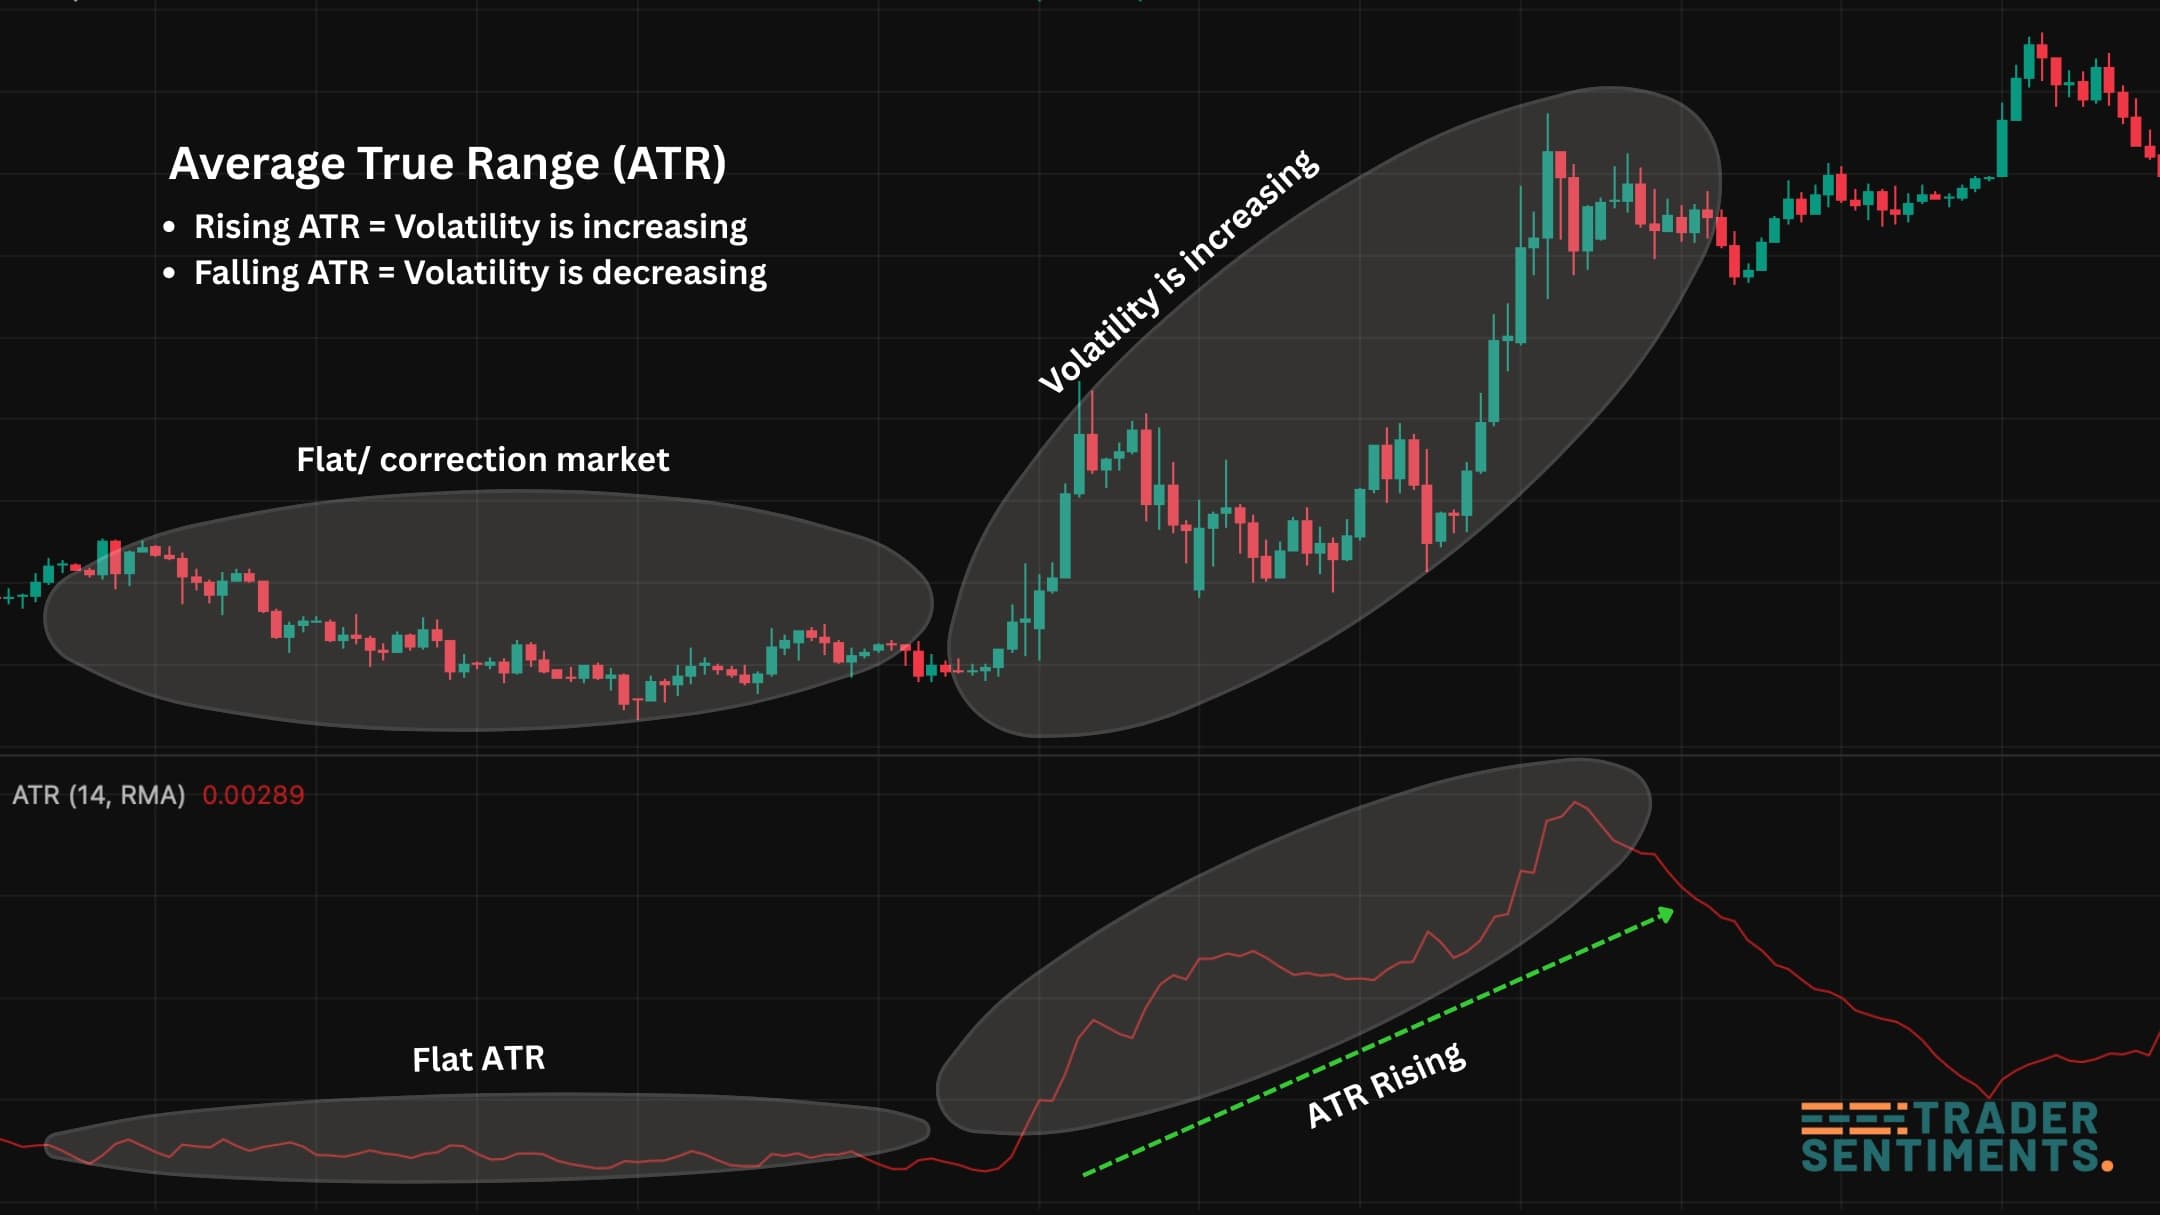
Example: when ATR rises, normal price movement increases — stop distance and position size should adapt.
ATR explained
ATR measures how much price moves (volatility). It does not predict direction. Traders use it to avoid tight stops, compare volatility across instruments, and keep risk consistent from trade to trade.
- Measuring volatility objectively (not based on feelings).
- Choosing stop distance that matches normal movement.
- Adjusting position size when markets speed up.
- Filtering “danger zones” (news spikes, high volatility sessions).
How ATR is calculated (True Range)
ATR is based on True Range (TR), which captures the real candle movement (including gaps).
- Current High − Current Low
- Absolute(Current High − Previous Close)
- Absolute(Current Low − Previous Close)
TR is the largest value above. ATR is the average of TR over N periods (commonly 14).
You don’t need to memorize formulas. The practical takeaway is: ATR rises when ranges expand and ATR falls when price becomes quiet.
How to read the ATR indicator
ATR is usually shown as a line under the chart. Higher ATR = higher volatility. Lower ATR = calmer conditions. Always interpret ATR relative to the instrument and timeframe.
Volatility is increasing. Stops often need more space, and position size should usually be smaller.
Volatility is decreasing. Ranges tighten; breakouts may be less frequent until volatility expands again.
Using ATR for stop-loss distance
Many stop-outs happen because the stop is placed inside normal volatility. ATR helps you avoid that. A clean rule is: structure first, ATR buffer second.
- Pick an invalidation level (structure/swing).
- Check ATR to see if your stop is too tight for current volatility.
- Add a buffer (example: 1× to 2.5× ATR depending on strategy/timeframe).
- Adjust position size to keep risk constant.
ATR doesn’t replace structure. It supports it. A good stop goes where your setup is invalidated, then ATR helps you avoid getting clipped by normal noise.
ATR for position sizing (risk normalization)
If volatility doubles, your stop distance often needs to be wider. To keep the same risk, your lot size should be smaller. ATR helps you keep risk consistent across different conditions and markets.
Without volatility-adjusted sizing, you may risk more on volatile days without realizing it.
Choose % risk → decide stop (structure + ATR buffer) → size position to match that risk.
ATR trailing stop concept
ATR trailing stops adapt to volatility. When markets get faster, the trailing distance widens. When markets calm down, the trailing distance tightens.
- Trail behind swing structure (best for trends).
- Use an ATR multiple as a volatility buffer.
- Avoid trailing too tight during pullbacks.
Risk management and common mistakes
ATR can improve your risk rules, but it can’t fix over-leverage. Most problems come from sizing and ignoring structure.
- Using ATR as a buy/sell signal
- Keeping the same stop in every market and session
- Ignoring spreads/news volatility spikes
- Not adjusting position size when ATR rises
- Confirm structure and key levels
- Avoid entries right before major news
- Watch spread widening in volatile sessions
- Compare ATR to recent history (20–60 bars)