Commodity Channel Index (CCI) is a momentum oscillator that measures how far price is from its statistical average. Traders use the CCI indicator to spot momentum shifts, overbought/oversold zones (commonly +100 / -100), trend strength, and divergence. This guide explains how CCI works, the CCI formula, best settings (CCI 20), and practical rules-based strategies with risk management.
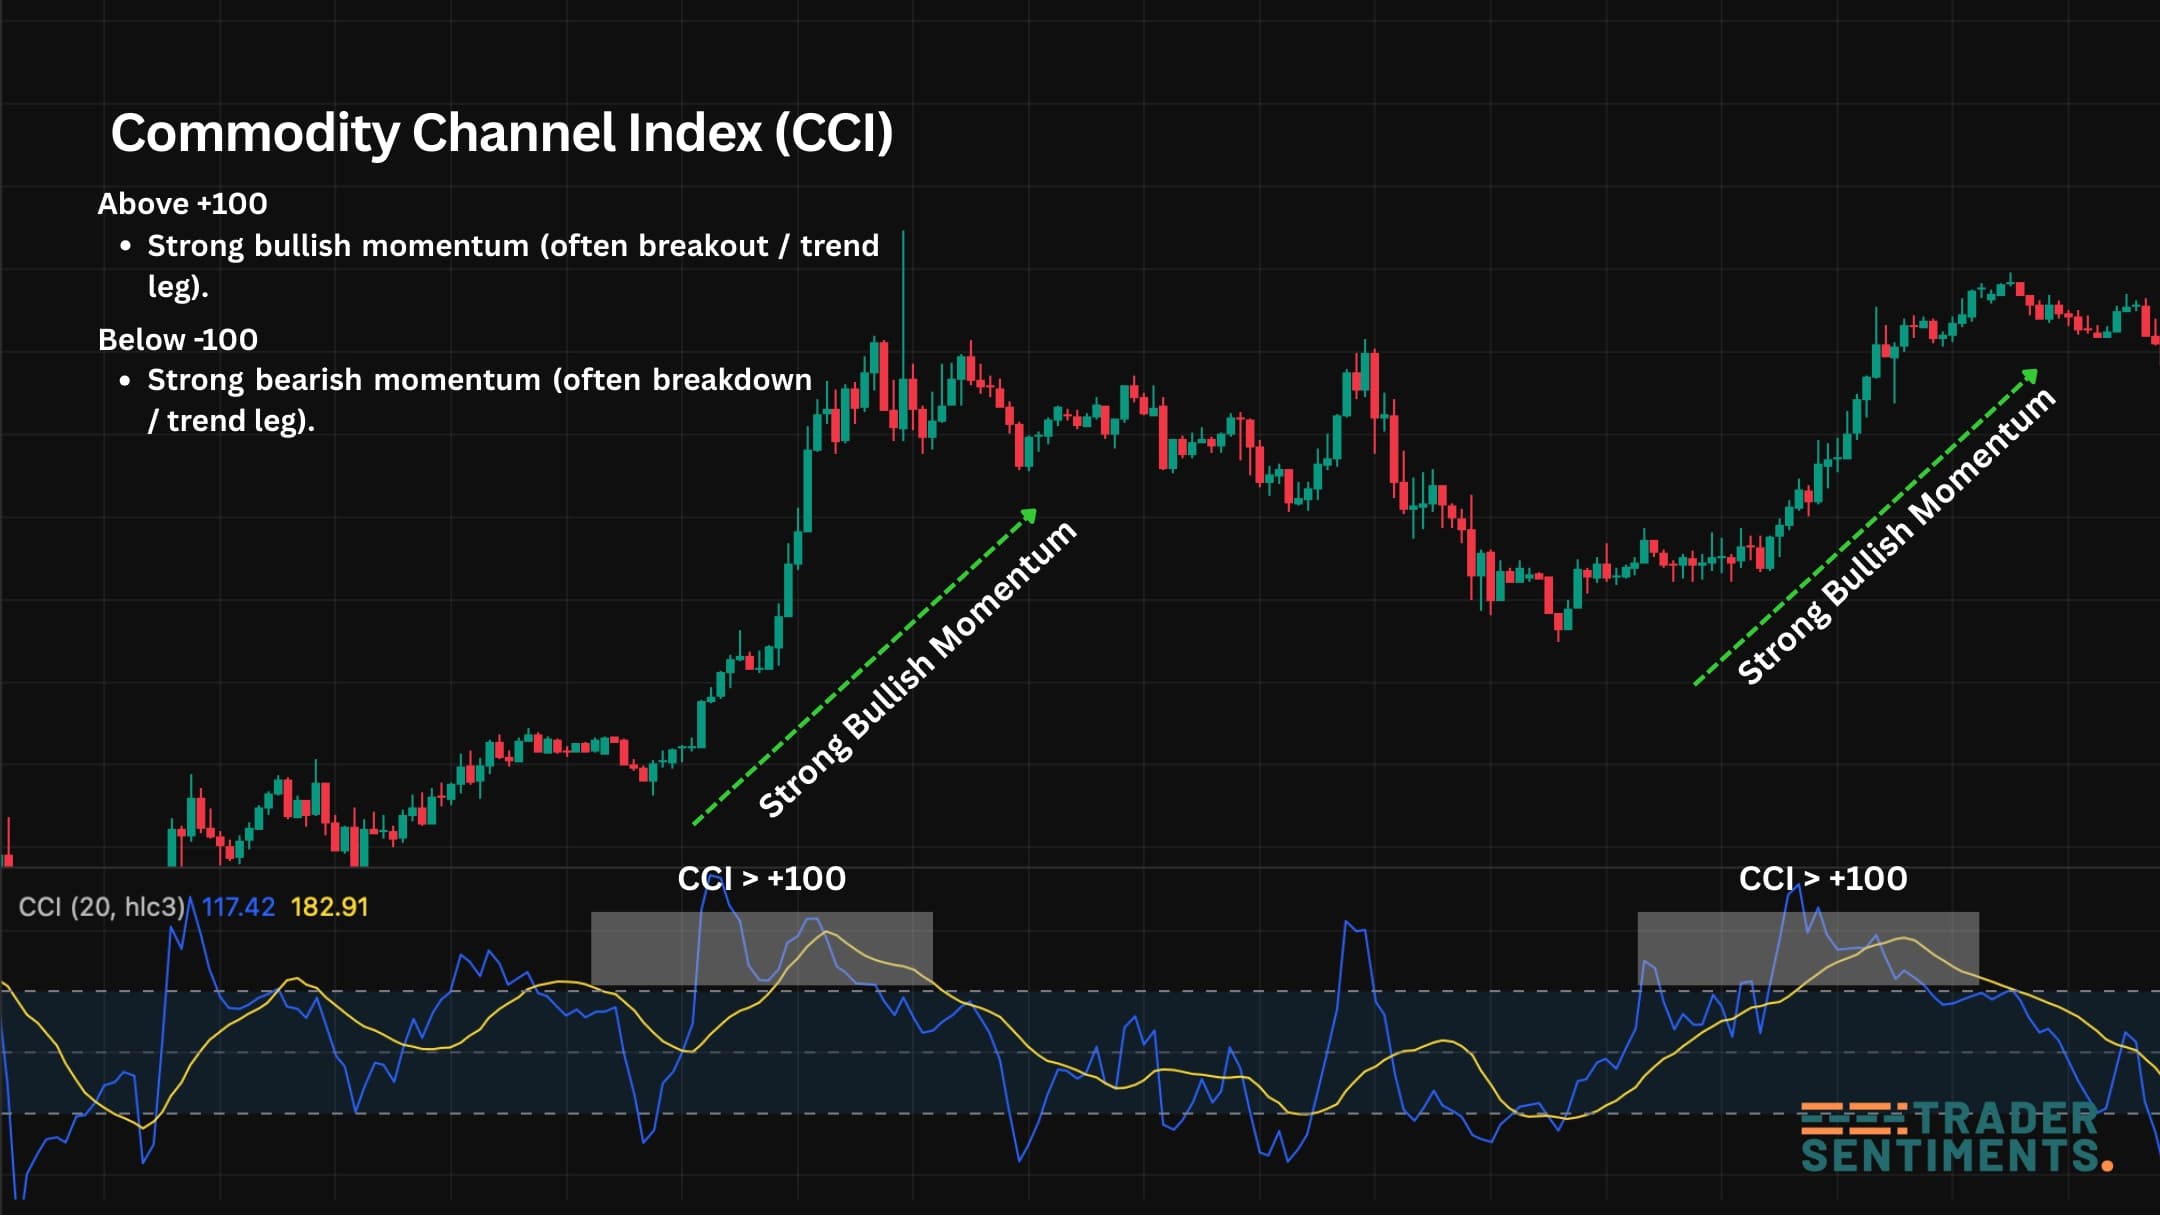
Example: CCI crossing +100 often signals strong upside momentum; -100 signals strong downside momentum.
CCI explained
CCI measures momentum by comparing current price (typical price) to its average over a chosen lookback period. When price is far above its average, CCI rises. When price is far below its average, CCI falls.
How CCI is calculated (CCI formula)
CCI uses Typical Price (TP) and compares it to an average with a volatility adjustment. Most platforms calculate this automatically, but the logic matters.
- Typical Price (TP): (High + Low + Close) / 3
- CCI: (TP − SMA(TP, N)) / (0.015 × Mean Deviation)
The constant 0.015 is used to normalize values so that most readings fall between -100 and +100.
Best settings (CCI 20) and variations
The default and most common setup is CCI(20). You can change the sensitivity depending on timeframe and style.
Balanced. Best starting point for most markets.
Faster signals but more noise and fake-outs.
Smoother momentum for higher timeframe trend context.
Don’t over-optimize settings. Keep a baseline (CCI 20) and improve your filters and risk rules.
How to read CCI (+100 / -100 / 0 line)
CCI is best used as a momentum confirmation tool. Use structure (trend/range, BOS, key levels) to decide the play; use CCI to confirm whether momentum agrees.
CCI momentum strategy (breakout continuation)
A clean CCI continuation framework: use price structure for direction, then confirm momentum with CCI.
- Market: trend or range breakout setup
- Trigger: price breaks structure + CCI pushes above +100 (long) / below -100 (short)
- Entry: retest of breakout level or continuation candle
- Stop: beyond structure invalidation (not based on CCI)
- Target: next key level or partial scale-outs
CCI mean reversion strategy (range days)
Mean reversion works best when structure confirms a range. Use CCI extremes as “overextension context”, not as an auto-buy/sell.
- Market: clear range (support/resistance respected)
- Setup: price tags range edge + CCI extreme beyond ±100
- Trigger: rejection candle / failure swing / reclaim inside range
- Stop: outside the range edge
- Target: midpoint / opposite range edge
CCI divergence (rules + filters)
Divergence can warn that momentum is weakening, but it’s not a timing tool by itself. Confirm with structure.
- Use divergence at key levels (swing highs/lows, support/resistance)
- Wait for a structure shift (BOS / reclaim)
- Avoid trading divergence against strong trend expansion
Risk management and common mistakes
- Fading +100 / -100 automatically in strong trends
- Using CCI as a standalone entry signal
- Stops too tight (inside normal volatility)
- No position sizing (risk changes trade-to-trade)
- Trend/range identification first
- Key level + structure confirmation
- Session timing (avoid dead hours)
- Volatility awareness (ATR / session range)
- Risk a fixed % per trade (example: 0.5%–1%)
- Stops go where the setup is invalidated (structure)
- Don’t add trades just because CCI stays extreme
- Track spread + slippage in fast conditions