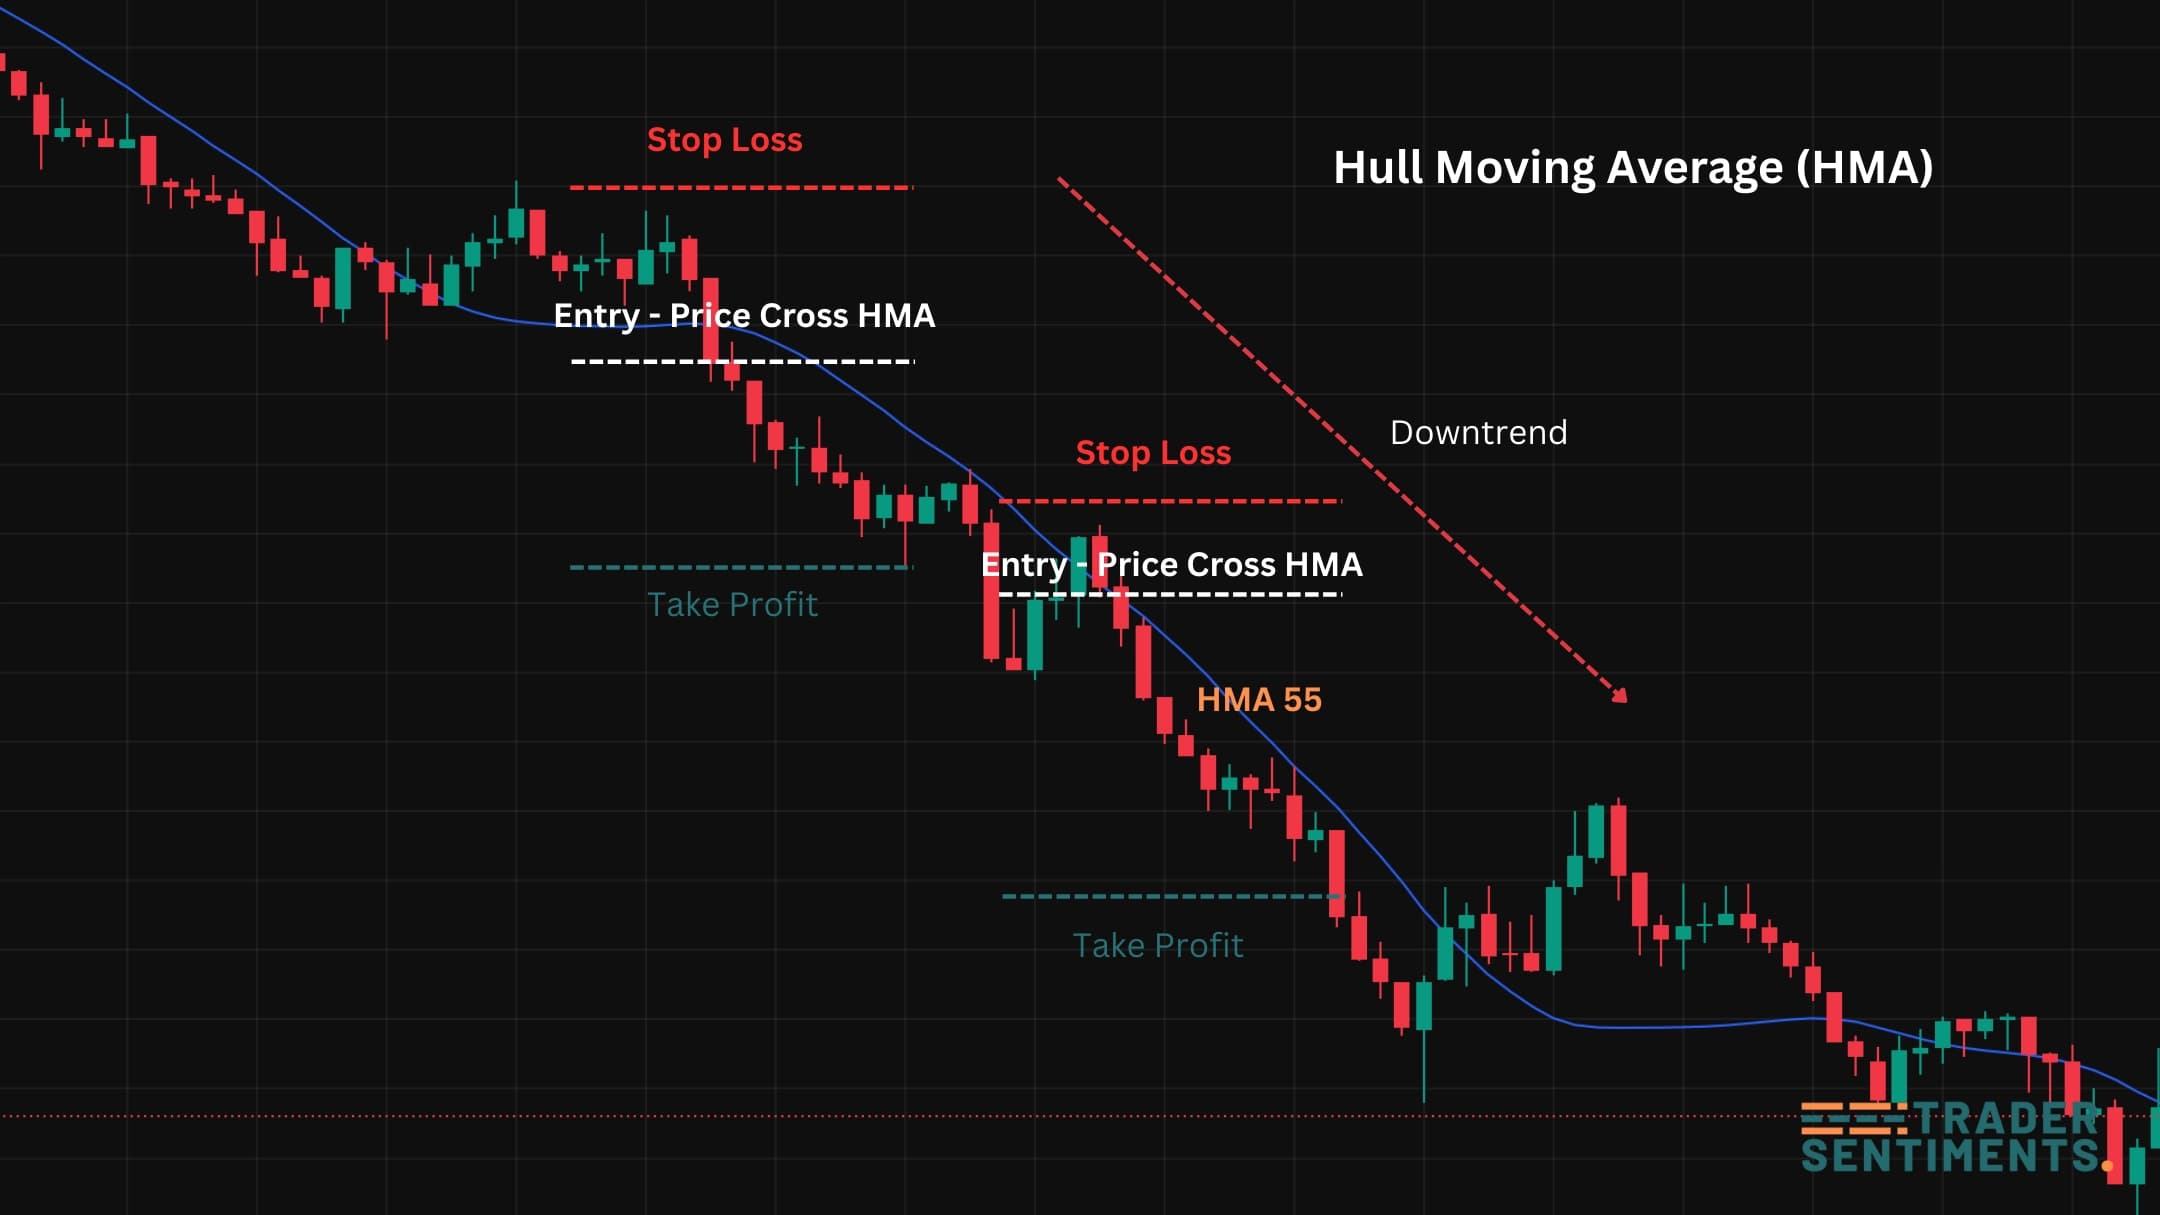
Hull Moving Average (HMA) is a moving average designed to reduce lag while staying smooth. Traders use the HMA indicator to confirm trend direction, time pullback entries, and spot momentum shifts earlier than traditional moving averages.
Example: HMA smooth trend direction + pullback timing.
HMA explained
HMA is designed for one goal: reduce lag while staying smooth. Traditional moving averages can be slow (lag) or noisy (fast settings). HMA tries to balance both by using weighted moving averages and a smoothing step based on the square-root of the period.
How HMA is calculated (formula idea)
Most platforms calculate HMA automatically. Conceptually, HMA uses weighted moving averages (WMA) to emphasize recent prices, then applies smoothing to keep the line clean.
HMA(n) = WMA( 2×WMA(price, n/2) − WMA(price, n), sqrt(n) )
You don’t need to compute this manually. The key takeaway: HMA responds faster than SMA/EMA while keeping the curve smoother.
How to read HMA (trend + slope)
A simple HMA filter many traders use: if price is repeatedly crossing the HMA back and forth, the market is likely ranging — reduce trend strategies and wait for structure clarity.
Best HMA settings (9/14/20/55)
Settings depend on timeframe and holding period. These are common starting points:
Faster signals for intraday timing. More sensitive, more whipsaws in chop.
Cleaner swing trend context. Great as a trend filter + pullback framework.
HMA strategies (rules-based)
- Bias: only long when price is above rising HMA
- Setup: pullback toward HMA zone
- Trigger: rejection candle / reclaim / structure confirmation
- Stop: below pullback swing (invalidation)
- Target: prior high / next key level
- Wait for clear structure shift (break/reclaim)
- Confirm HMA slope changes and holds
- Avoid trading flips inside ranges
- Use strict risk (small % per trade)
HMA vs EMA (when to use each)
If you’re building educational content or common strategies, EMA pages usually attract broader search. HMA is great as an “advanced alternative” for traders looking for smoother, faster trend lines.
Risk management and common mistakes
- Trading HMA flips inside ranges
- Using HMA as an exact line (treat as a zone)
- No structure confirmation
- Over-leverage because “trend looks clean”
- Higher timeframe bias
- Key levels (S/R) + structure
- ATR / volatility awareness
- Session timing (avoid dead hours)
- Risk a fixed % per trade (example: 0.5%–1%)
- Stops go beyond invalidation (structure)
- Scale out at key levels
- Track spread + slippage in fast moves