
Parabolic SAR (Stop and Reverse) is a trend-following indicator that plots dots above or below price. Traders use PSAR to stay with the trend, manage trailing stops, and spot potential reversals when dots flip sides. This guide explains how PSAR works, practical settings, rule-based trade ideas, and common mistakes.
Parabolic SAR explained
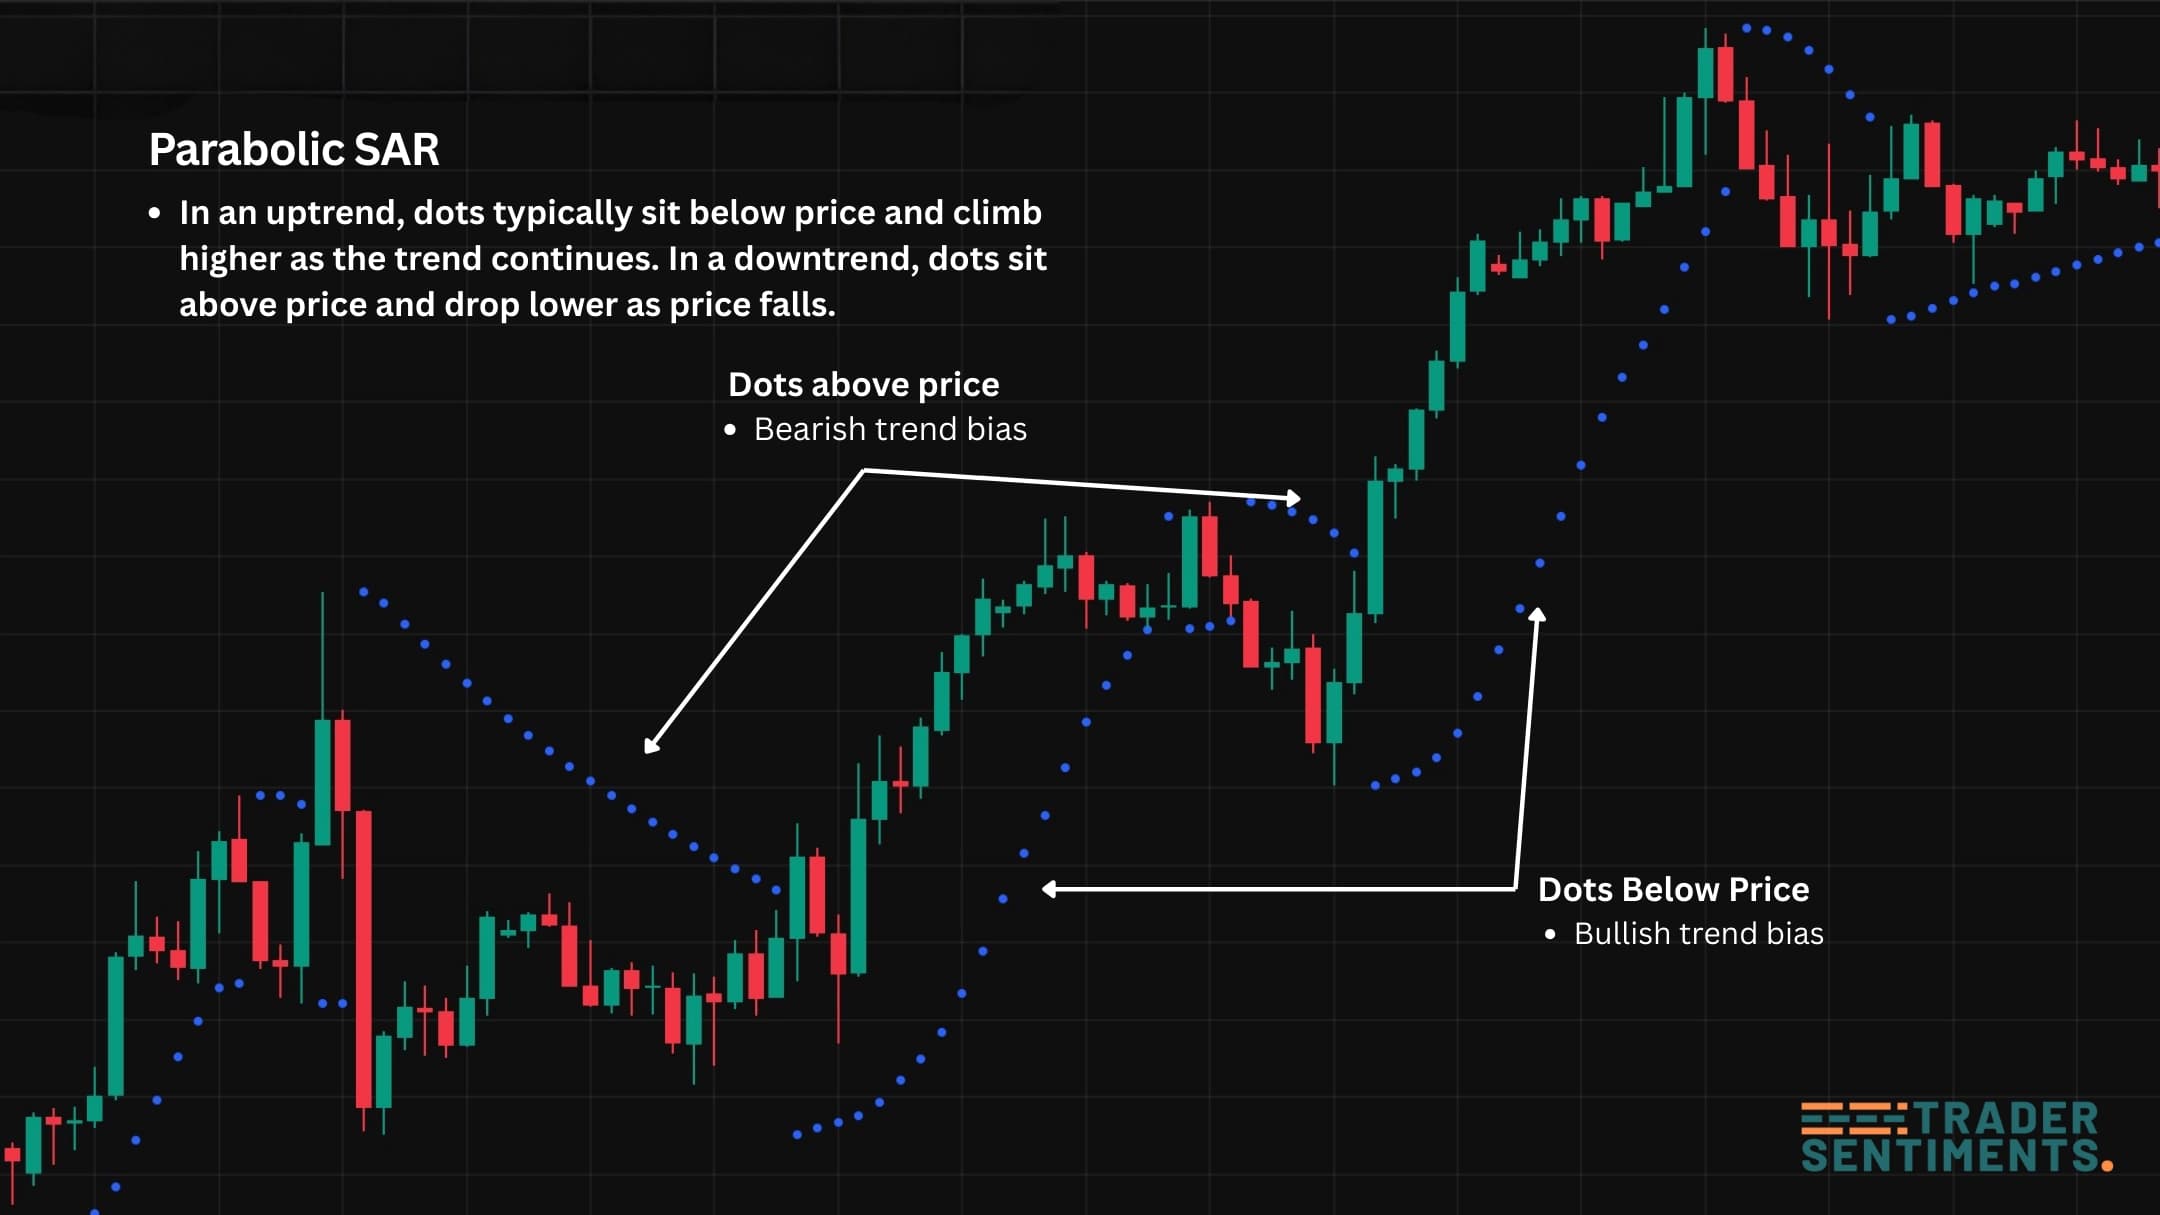
Parabolic SAR plots a “stop level” (the dots) that moves in the direction of the trend. In an uptrend, dots typically sit below price and climb higher as the trend continues. In a downtrend, dots sit above price and drop lower as price falls.
- Trend-following bias (dots below vs above price)
- Trailing stop logic (dots as dynamic stop levels)
- Exit signals (dot flips after momentum shifts)
- Trend strength clues (smooth dot progression vs frequent flips)
How Parabolic SAR is calculated
PSAR uses an acceleration factor (AF) that increases as the trend continues. As new extremes form (higher highs in an uptrend / lower lows in a downtrend), AF increases up to a maximum—making the dots “catch up” to price faster.
- Step (AF step): how quickly the dots accelerate (commonly 0.02)
- Max (AF max): cap on acceleration (commonly 0.2)
- Extreme Point (EP): the highest high / lowest low during the trend leg
You don’t need to memorize the math to trade it. Practically, faster settings = more flips (more signals, more noise). Slower settings = fewer flips (cleaner trends, later exits).
Example: in a trend, dots “follow” price and act like a trailing stop guide.
How to read PSAR dots (trend + flips)
Bullish trend bias. Many traders prefer longs while dots remain below price and use the dots (or structure) as a trailing exit reference.
Bearish trend bias. Many traders prefer shorts while dots remain above price and trail stops above the dots.
A flip happens when price crosses the SAR level and dots switch sides. Treat flips as an alert, not a guarantee. In ranges, flips can happen repeatedly.
Best PSAR settings (0.02/0.2 and variations)
The default settings (0.02 step, 0.2 max) are widely used. Adjust based on your market + timeframe:
- Example: 0.03 / 0.3
- Earlier exits and more flips
- Better for strong momentum, worse for ranges
- Example: 0.01 / 0.1
- Fewer flips, later exits
- Can hold trends longer but gives back more profit
Tip: keep settings consistent and backtest on your instrument. A “better” setting is the one that fits your rules and risk tolerance.
PSAR as a trailing stop (practical rules)
This is where PSAR shines: it helps you stay in trends while gradually tightening the stop as the move extends. Treat the dot as a trailing stop reference, but don’t ignore structure.
- Enter using your main setup (structure/EMA/level), not PSAR alone
- Trail stop at the PSAR dot (or slightly beyond to reduce noise)
- Exit if a candle closes beyond the dot + structure breaks
- In strong trends, consider partial profits at key levels
PSAR entry strategies (rules-based)
- Filter: higher timeframe trend is up (or down)
- Trigger: PSAR stays on trend side after pullback (no rapid flip back)
- Entry: break-and-retest / rejection candle at a key level
- Stop: beyond structure invalidation (then trail with PSAR)
Only take PSAR bullish bias when price is above a trend EMA (e.g., 50 EMA) and bearish bias when below it. This reduces range noise where dots flip repeatedly.
Risk management and common mistakes
- Trading every flip in a range (whipsaw)
- Using PSAR as a standalone entry signal
- Stops too tight: getting clipped by normal volatility
- Ignoring news spikes and session liquidity
- Trend filter (EMA 50/200 or structure HH/HL)
- Don’t trade chop: if dots flip often, reduce signals
- Volatility filter (ATR/session range awareness)
- Trade fewer, cleaner setups
- Risk a fixed % per trade (example: 0.5%–1%)
- Stops go where the setup is invalidated (structure)
- Trail with PSAR only after price moves in your favor
- Track slippage/spread in fast markets