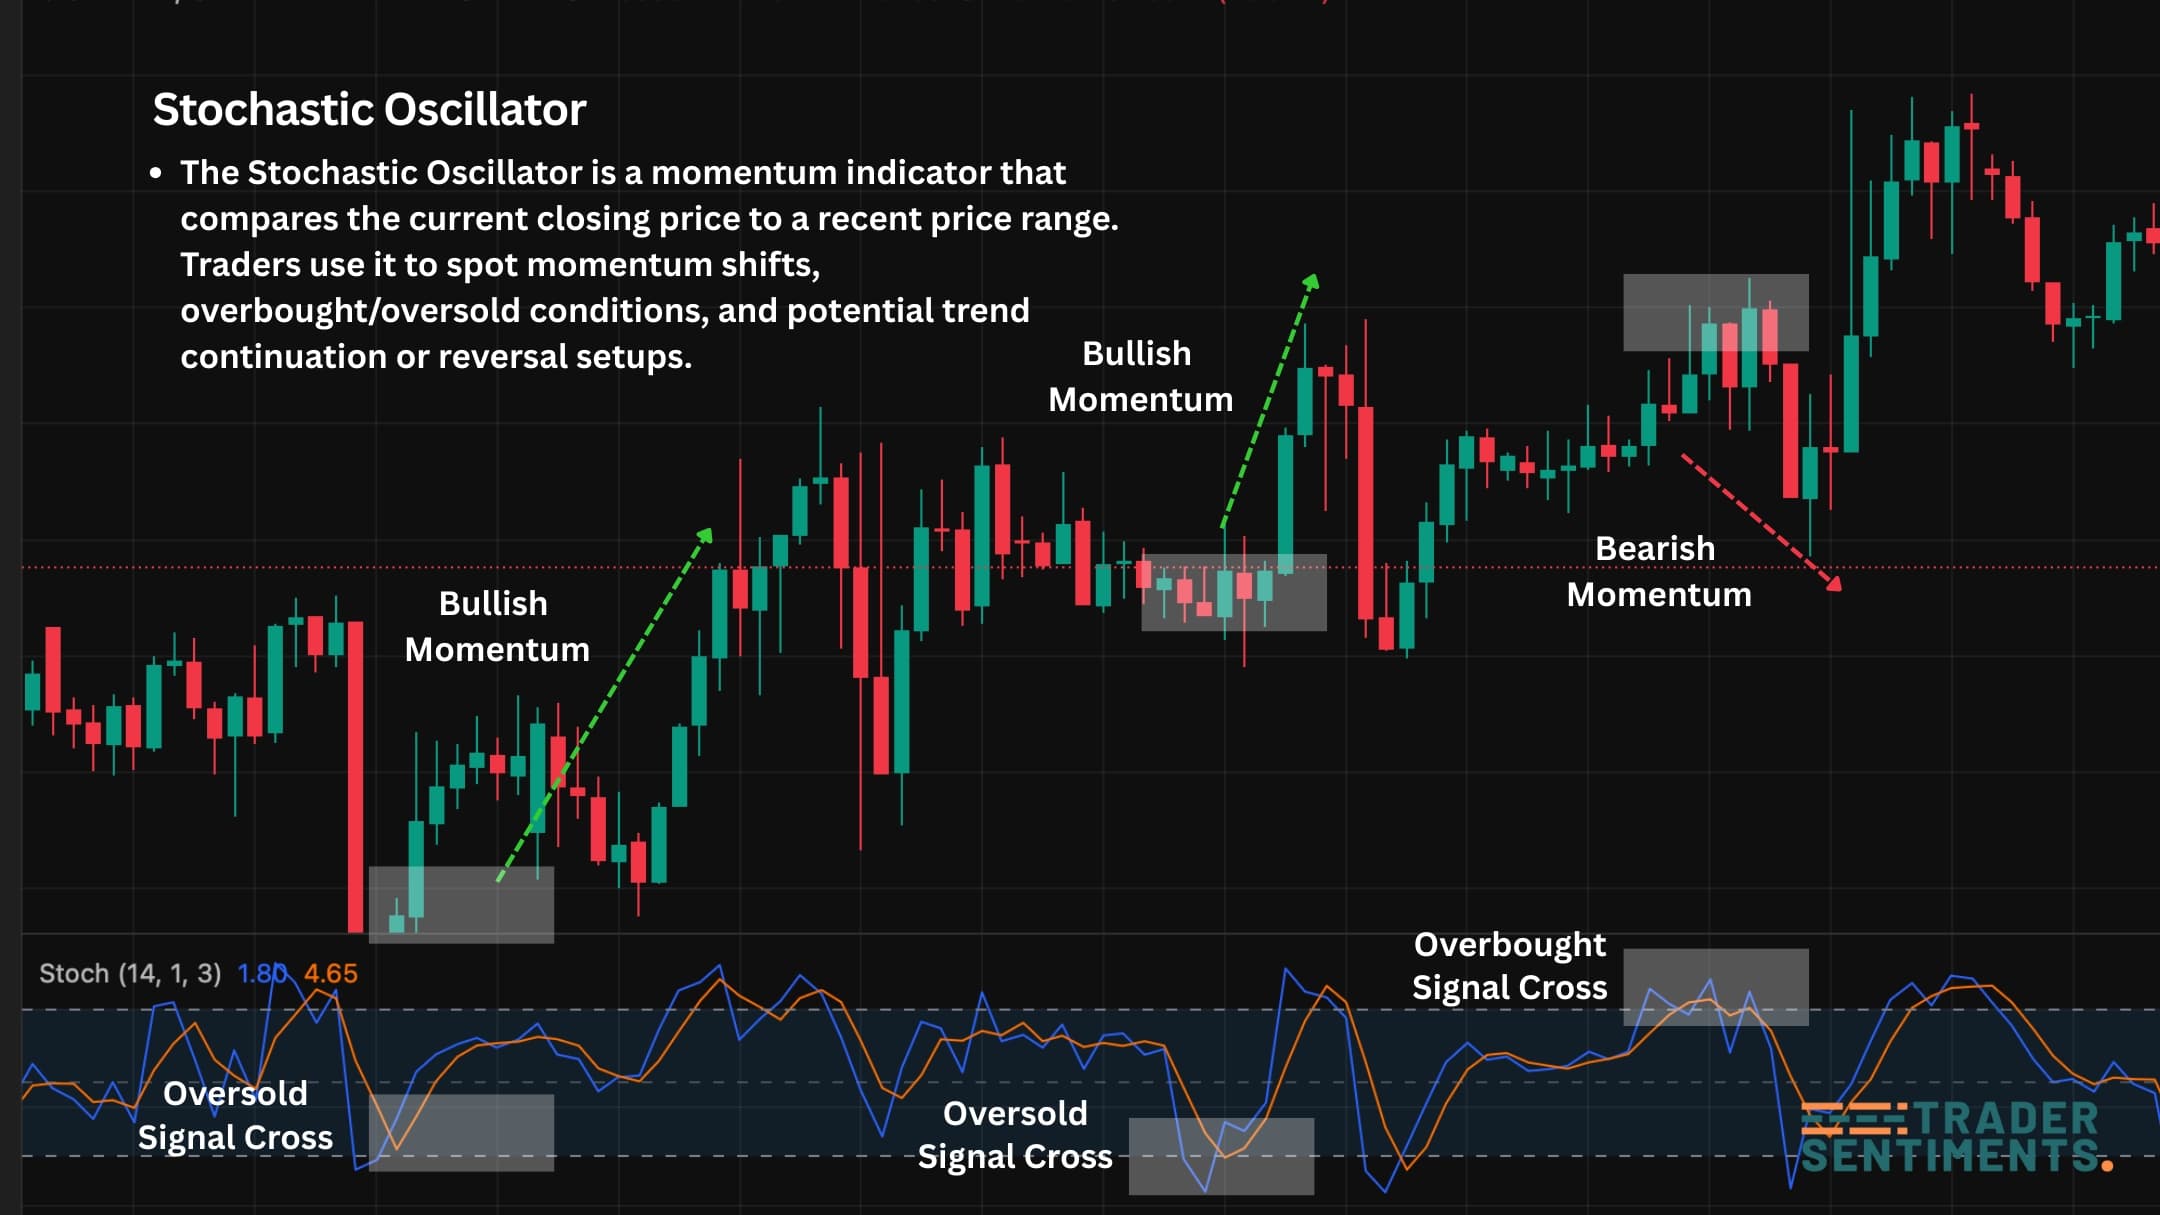
The Stochastic Oscillator is a momentum indicator that compares the current closing price to a recent price range. Traders use it to spot momentum shifts, overbought/oversold conditions, and potential trend continuation or reversal setups.
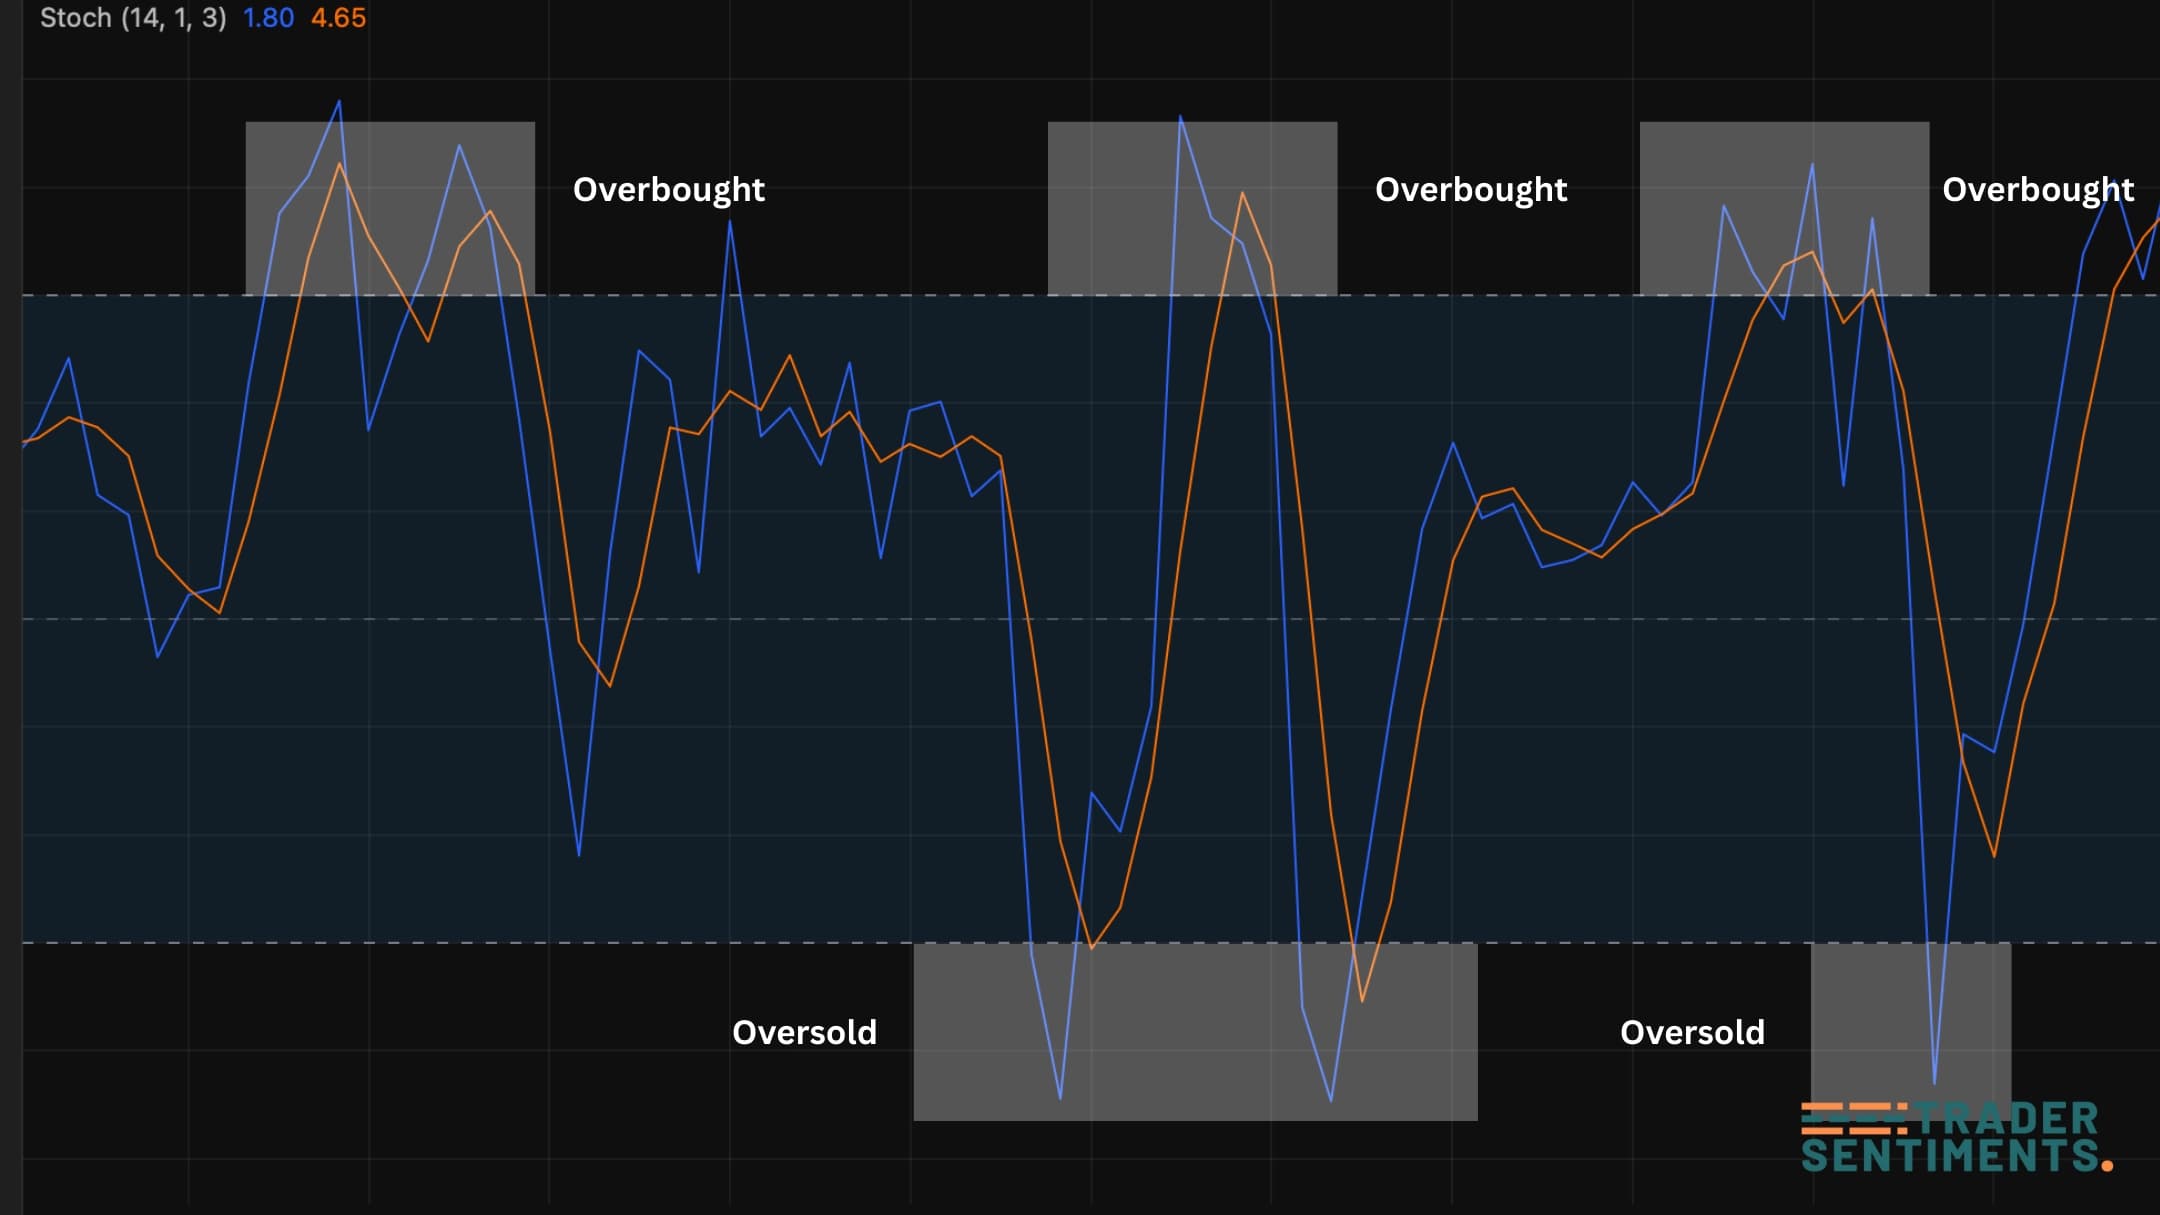
Example: Stochastic entering overbought/oversold zones—use it with structure, not alone.
Stochastic explained
The Stochastic Oscillator compares the current close to the recent trading range. When price closes near the top of the range, momentum is stronger; when it closes near the bottom, momentum is weaker.
- Momentum shift confirmation
- Overbought/oversold context (especially in ranges)
- Trend pullback timing (when trend is clear)
How the Stochastic is calculated
Stochastic assumes that in an uptrend, price tends to close near the highs of the range, and in a downtrend, it closes near the lows.
- 14, 3, 3 (default): balanced
- 21, 5, 5: smoother
- 9, 3, 3: faster, more noise
How to read signals
Above 80 = overbought, below 20 = oversold. In strong trends, it can stay extreme for a long time.
Crossovers show momentum shifting. Best when aligned with key levels and trend context.
Trading strategies
Define trend on H4/D1. Wait pullback into a key level. Use Stochastic to confirm momentum turning back with trend.
In ranges, combine boundary + extreme stochastic + shift. Use tight invalidation (ranges break).
Avoid entries when stochastic is clearly rolling over against your setup momentum.
Common mistakes
- Trading every extreme as an automatic reversal
- Counter-trend entries in strong trends
- Too sensitive settings = noise
- No structure and no invalidation plan